Codes related to modeling the role of contact-mediated cellular interactions in cell fate determination driven by positional information.
The codes reproduce the results reported in
C. Kuyyamudi, S.N. Menon and S.Sinha
Flags, Landscapes and Signaling: Contact-mediated inter-cellular interactions enable plasticity in fate determination driven by positional information Indian Journal of Physics, 96(9): 2657-2666 (2022). https://doi.org/10.1007/s12648-022-02348-6 arXiv:2202.05731 https://arxiv.org/abs/2202.05731
Aim: To investgate the consequence of different types of inter-cellular coupling schemes between cells on the expression dynamics of the genes B, W and R, and hence, cell fate.
In order to run the French_Flag_All_Types.jl, Julia version 1.7 or higher with "Differential Equations", "Random" and "NPZ" libraries needs to be installed.
The various coupling types differ from each other in terms of: (i) whether the ligand is activated/inhibited/unaffected by each of the patterning genes B, W and R, and (ii) whether the genes B, W and R are themselves regulated by NICD positively/negatively/not at all.
Thus, each of the 3^6 =729 possible coupling types can be uniquely represented by a ternary string, each digit of which is interpreted as follows: 0: no regulation 1: positive edge (activation/positive regulation) 2: negative edge (inhibition/negative regulation)
Note also that the 6 digits in each string starting from left to right represent the nature of regulation by NICD of (i) B, (ii) W and (iii) R genes, and the effect on the ligand of regulation by (iv) B, (v) W and (vi) R genes.
As coupling type 0 implies the absence of any coupling, we have not included this type explicitly in the program.
The specific coupling type i (between 1-728) can be chosen by setting the numerical value of the Coupling Id "CID" equal to i. The number of iterations for which the expression dynamics is simulated can be set using the variable "niters".
By default the output is stored in ".npy" format inside a directory named "Data", so it is essential to create a directory named "Data" within the working directory. Alternatively one can change the PATH variable inside the "Explore_All_Thetas" function.
The output array will contain the state of the thirty cells for each iteration. Hence the array will comprise niters rows and 30 columns.
The time-series of the cell states stored in the output array can be visualized using the program FF_Visualization_App.py In order to use this code, Python3 needs to be installed with the following libraries -Numpy -Matplotlib -Scipy -Networkx
The code uses the data files available in the "Vis_Data" directory to give a visual summary of the flags obtained for a given coupling type using 10000 randomly sampled values for the six coupling parameters.
-
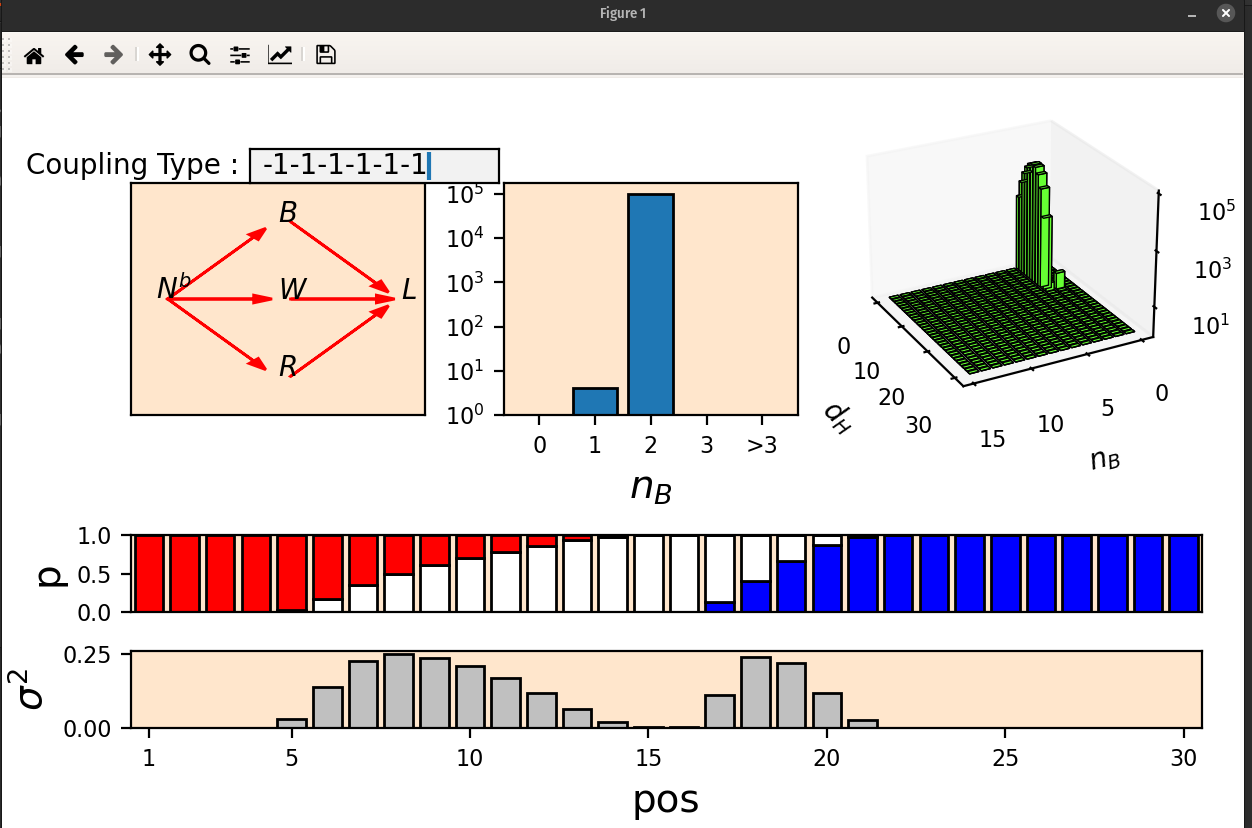
In the top box, the coupling types can be specified by using a string of length 6 containing only the digits 0 (no regulation), 1 (activation/positive regulation) and -1 (inhibition/negative regulation). For example the screenshot shows the case when the coupling type is "-1-1-1-1-1-1", i.e., all interactions between genes and ligands, as well as between NICD and genes, are negative or inhibitory.
-
To choose a coupling type, the ternary string (comprising +1,0 and-1) needs to be entered and Enter key pressed twice
-
The figure at top left shows the connectivity structure for the given coupling type. A green arrow represents positive link, red arrow a negative link and absence of link represents no regulation.
-
The figure at top center shows the frequency histogram of the number of boundaries in the flags that are obtained using the 10000 randomly sampled sets of parameter values for the coupling type.
-
The top right figure shows the joint frequency histogram of nB (number of boundaries) and dH ( hamming distance from the idealized pattern comprising three regions expressing B,W and R having equal lengths), similar to the figures shown in our paper (cited at the beginning of this readme file).
-
The figure in the middle row shows the proportion of each of the three fates at the 30 different cell sites using stacked bar plots
-
The figure at the bottom shows the variance of cell fates at each of the 30 sites.
