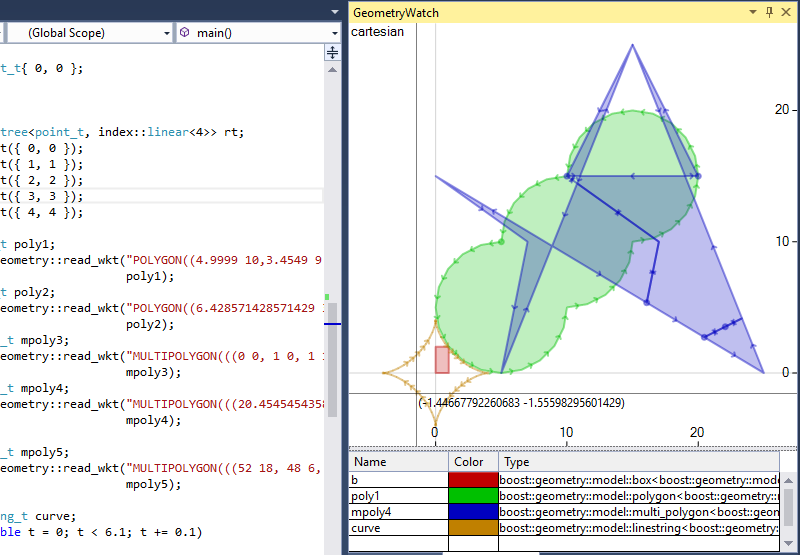
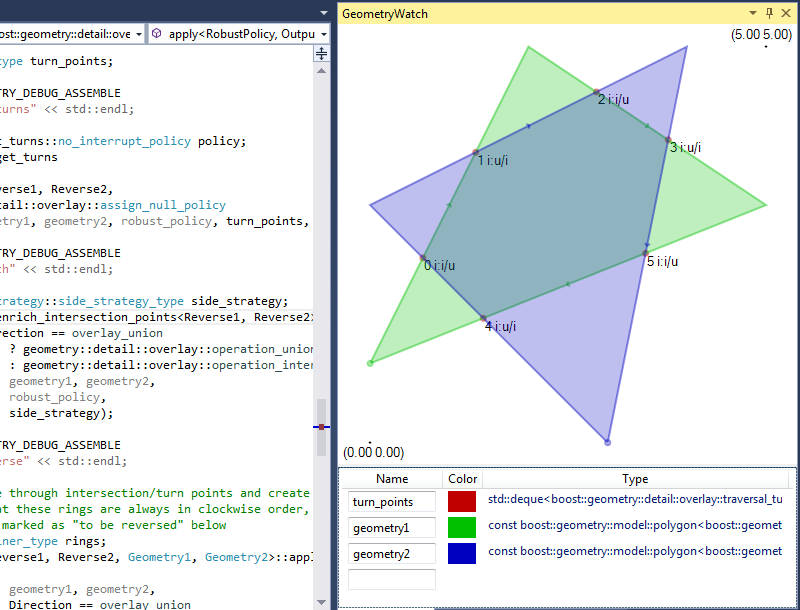
This extension allows to display graphical representation of variables during debugging.
Currently it supports Boost.Geometry and Boost.Polygon models, Boost.Variant and STL/Boost containers of values. It contains:
- Debugging visualizers for Boost.Array, Boost.Container, Boost.Geometry, Boost.MPL, Boost.Polygon, Boost.Tuple and Boost.Variant
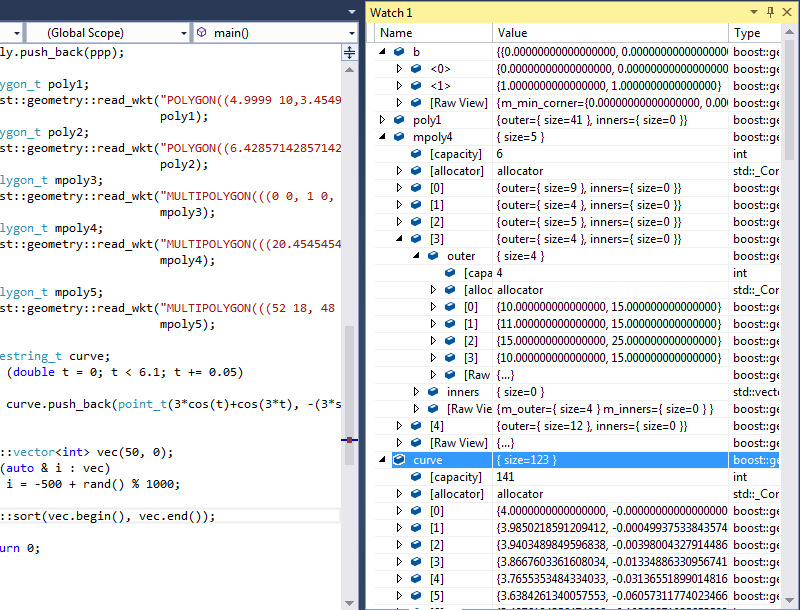
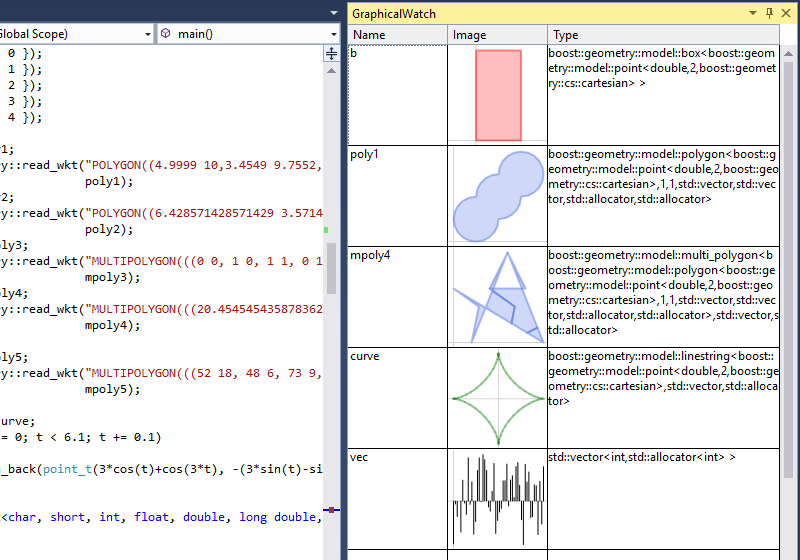
- GraphicalWatch tool window displaying graphical representation of variables, e.g. Boost.Geometry models or vectors of values
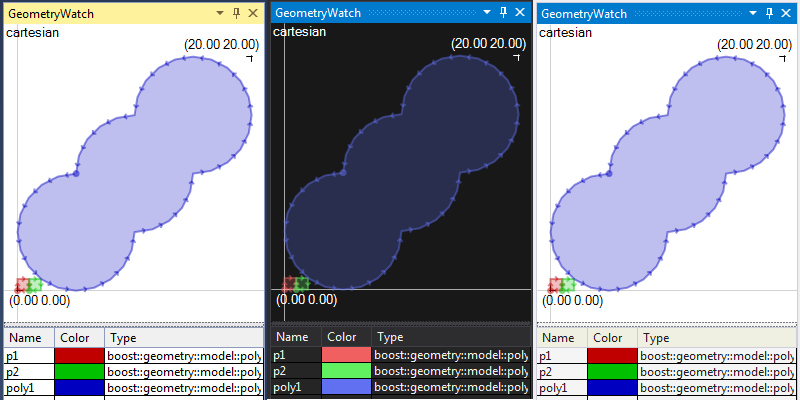
- GeometryWatch tool window displaying geometries in a common coordinate system, e.g. Boost.Geometry or Boost.Polygon polygons
Feel free to report bugs, propose features and create pull requests. Any help is appreciated.
You can download this extension from Visual Studio Gallery.
You may contact me at Boost.Geometry mailing list.
You need e.g. Microsoft Visual Studio 2015 Community, .NET Framework 4.5.2 and Visual Studio 2015 SDK.
To install after building double-click the *.vsix file from bin/Debug or bin/Relase directory.
- place a breakpoint somewhere in the code
- start debugging
- after a breakpoint hit enable the tool window from the menu
- View->Other Windows->GraphicalWatch
- View->Other Windows->GeometryWatch
- write the name of a variable in an edit box on the list
Supported:
- Boost.Array: array
- Boost.Container: vector, static_vector
- Boost.Geometry:
- de9im: mask, matrix, static_mask
- detail: turn_info, traversal_turn_info
- index: rtree, varray
- model: point, point_xy, box, segment, referring_segment, polygon, multi_point, multi_linestring, multi_polygon, nsphere
- Boost.MPL: int_, size_t, integral_c, vector, vector_c
- Boost.Polygon: point_data, interval_data, segment_data, rectangle_data, polygon_data, polygon_with_holes_data
- Boost.Tuple: tuple, cons
- Boost.Variant: variant
Watch window displaying graphical representations of variables in a list. Each variable is placed and visualized in a separate row.
Supported:
- Containers of elements convertible to double
- STL: array, vector, deque, list
- Boost.Array: array
- Boost.Container: vector, static_vector
- 2D cartesian geometries
- Boost.Geometry: point, point_xy, box, segment, referring_segment, polygon, multi_point, multi_linestring, multi_polygon, nsphere
- Boost.Polygon: point_data, segment_data, rectangle_data, polygon_data, polygon_with_holes_data
- Non-cartesian geometries (spherical_equatorial and geographic)
- Boost.Geometry: point, box, segment, referring_segment, polygon, multi_point, multi_linestring, multi_polygon, nsphere
- Variants of geometries
- Boost.Variant
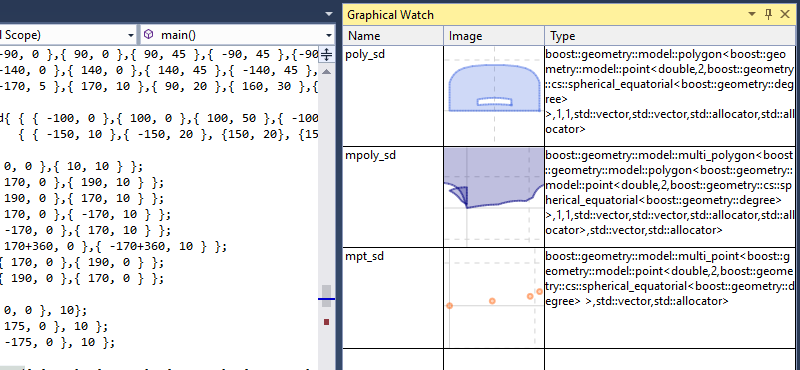
Geometries in spherical_equatorial and geographic coordinate systems are displayed in a convenient, compact way.
where
polygon_sd_t poly_sd{{{-100, 0},{100, 0},{100, 50},{-100, 50},{-100, 0}},
                     {{-150, 10},{-150, 20},{150, 20},{150, 10},{-150, 10}}};
multi_polygon_sd_t mpoly_sd{{{{0, 0},{90, 10},{170, 20},{-170, 30},{-150, 60}},
                             {{0, 10},{-15, 20},{-50, 50},{0, 60}}}};
multi_point_sd_t mpt_sd{{0, 0},{90, 10},{170, 20},{-170, 30}};
Watch window displaying graphical representation of variables in a single image. This allows to compare the variables easily.
Supported:
- 2D cartesian geometries
- Boost.Geometry: point, point_xy, box, segment, referring_segment, polygon, multi_point, multi_linestring, multi_polygon, nsphere
- Boost.Polygon: point_data, segment_data, rectangle_data, polygon_data, polygon_with_holes_data
- Non-cartesian geometries (spherical_equatorial and geographic)
- Boost.Geometry: point, box, segment, referring_segment, polygon, multi_point, multi_linestring, multi_polygon, nsphere
- Variants of geometries
- Boost.Variant
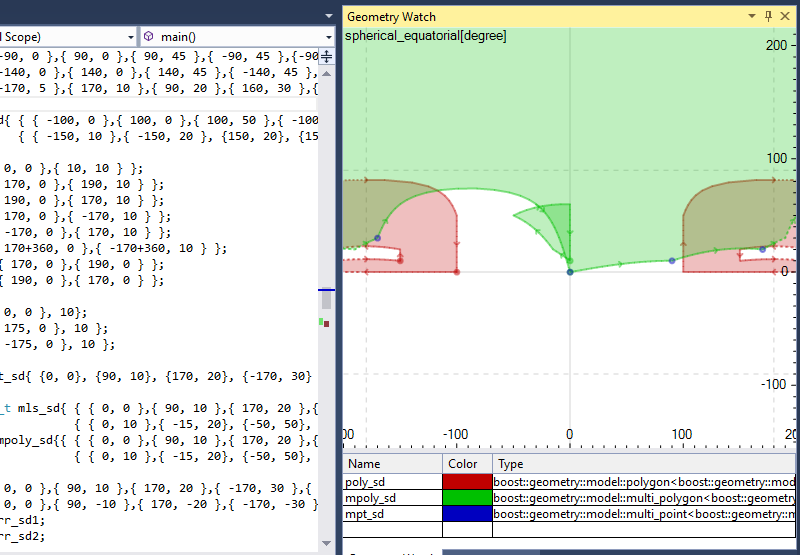
Geometries in spherical_equatorial and geographic coordinate systems are displayed in a way allowing to see what coordinates were used to define a geometry. Note that various libraries may require coordinates in a certain range. This extension tries to display any coordinates as good as possible.
where
polygon_sd_t poly_sd{{{-100, 0},{100, 0},{100, 50},{-100, 50},{-100, 0}},
                     {{-150, 10},{-150, 20},{150, 20},{150, 10},{-150, 10}}};
multi_polygon_sd_t mpoly_sd{{{{0, 0},{90, 10},{170, 20},{-170, 30},{-150, 60}},
                             {{0, 10},{-15, 20},{-50, 50},{0, 60}}}};
multi_point_sd_t mpt_sd{{0, 0},{90, 10},{170, 20},{-170, 30}};
The extension supports Visual Studio themes. The visualization of variables may be drawn in two versions, dark or light depending on the brightness of the theme background color.
