This is a repository of user contributed snufflings.
Snufflings are plugins for the Snuffler application which is part of Pyrocko.
To use any of these snufflings, simply put the respective file or directory
into the $HOME/.snufflings directory.
If you want to modify, develop, or keep up to date on any of these, it is
preferable to clone the whole repos somewhere in your filesystem and just make
symbolic links in $HOME/.snufflings for each snuffling to be used.
The setup.py script included in this repository provides a shortcut to
create required symbolic links. Running python setup.py link will do
that for you. If you find yourself with broken (dangling) symlinks e.g. after
checking out a different branch you can remove all broken symlinks in your
$HOME/.snufflings directory by adding --undangle to the link command.
To add your own creation, simply clone this repos, add your stuff and a screenshot and send a pull request.
It is recommended to add some documentation at the top of each snuffling right beneath the snuffling's class name. This text will be shown when pressing the 'Help' on the snuffling's panel and should give a rough overview of the functionalities. Wrapping this text in html code can be used to pretty up the documentation.
Do you have a great idea for a new snuffling? Do you miss some feature in one snuffling? Did you discover a bug? Given this you can click on 'Issues' and open up a 'New Issue'. Describe the problem and wait until the community takes on action.
Plot station and event locations with OpenStreetMap or Google Maps
directory: map
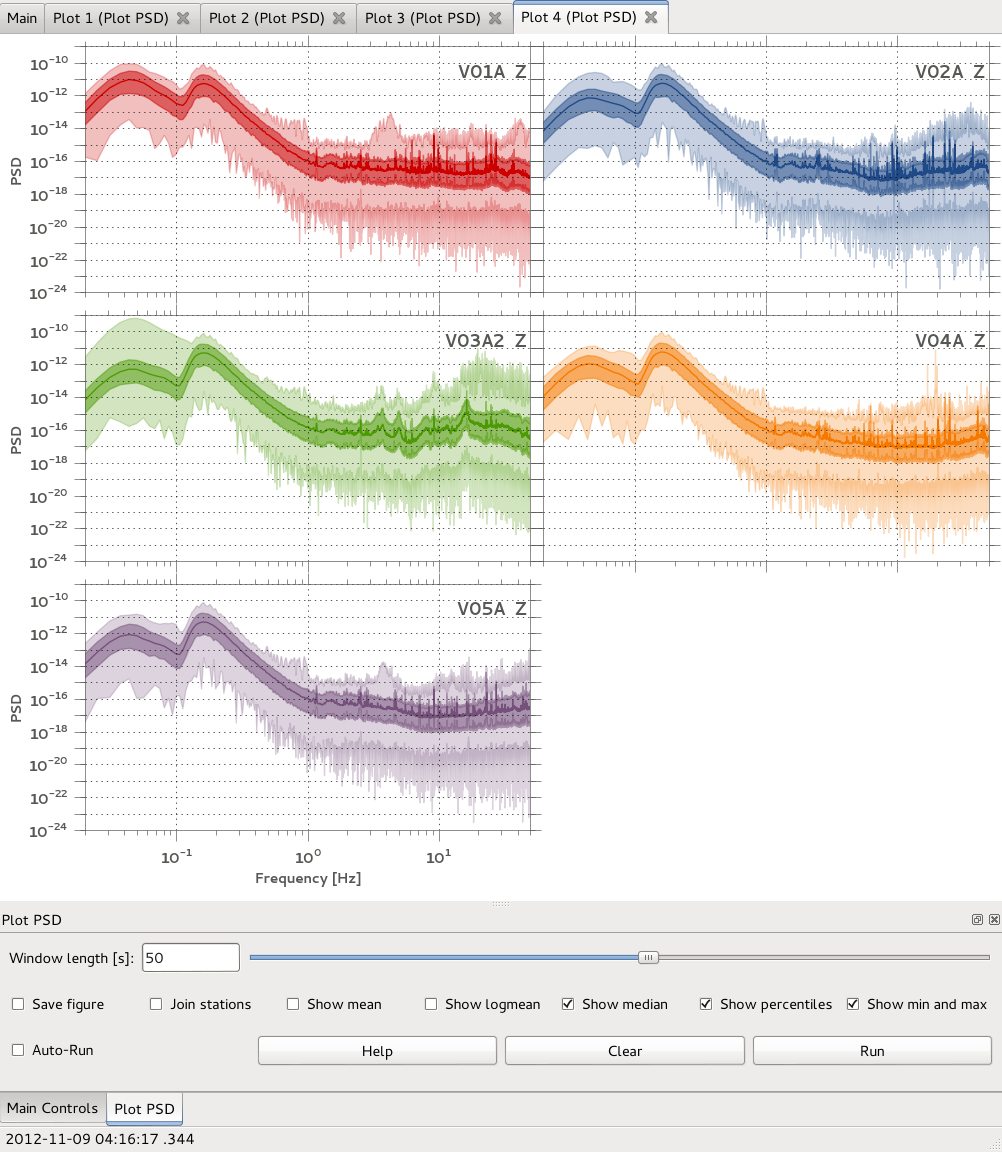
Plot power spectral densities
file: psd.py
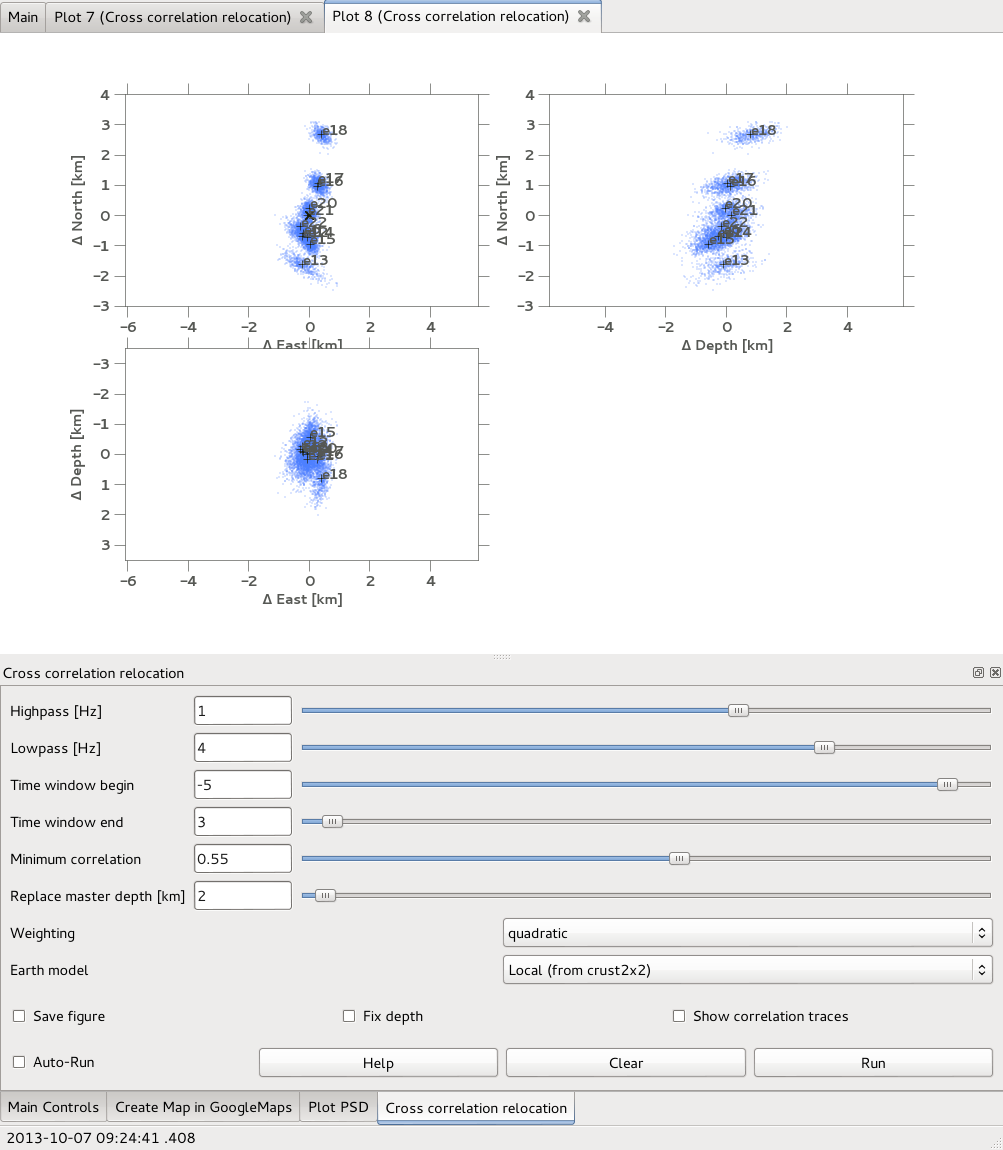
Relocate events by cross correlating waveforms
file: cc_relocation.py
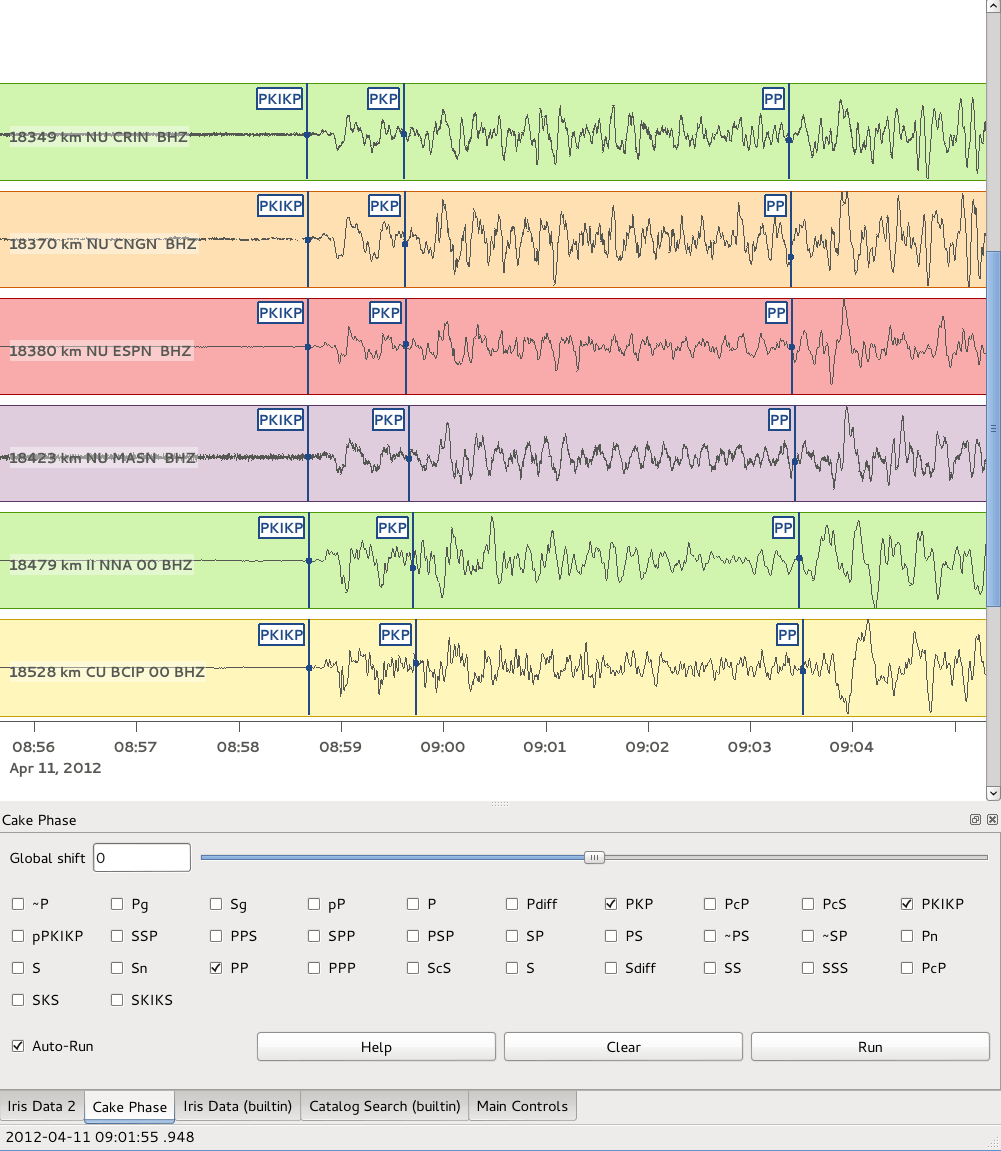
Add markers for synthetic arrivals
file: cake_phase.py
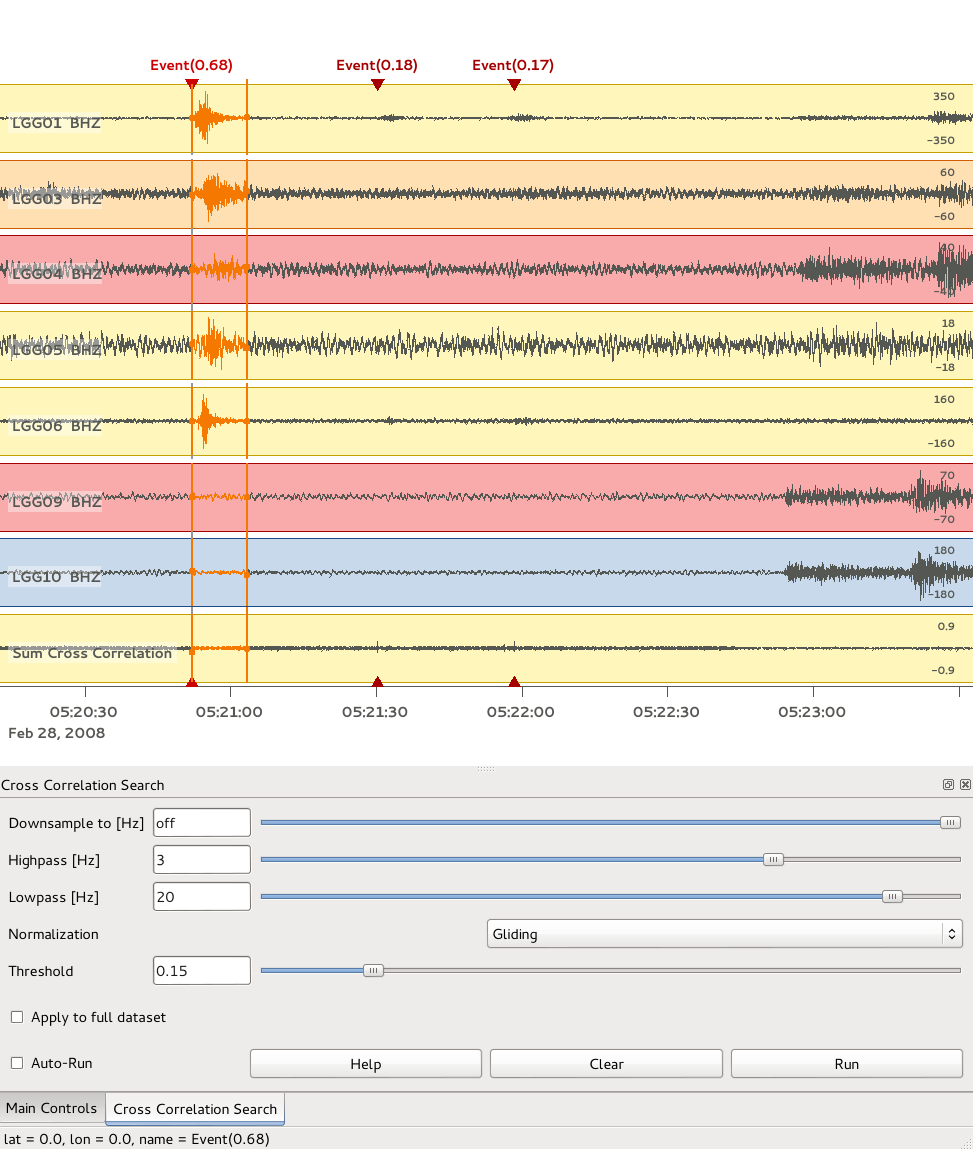
Find repeating events
file: corrsearch.py
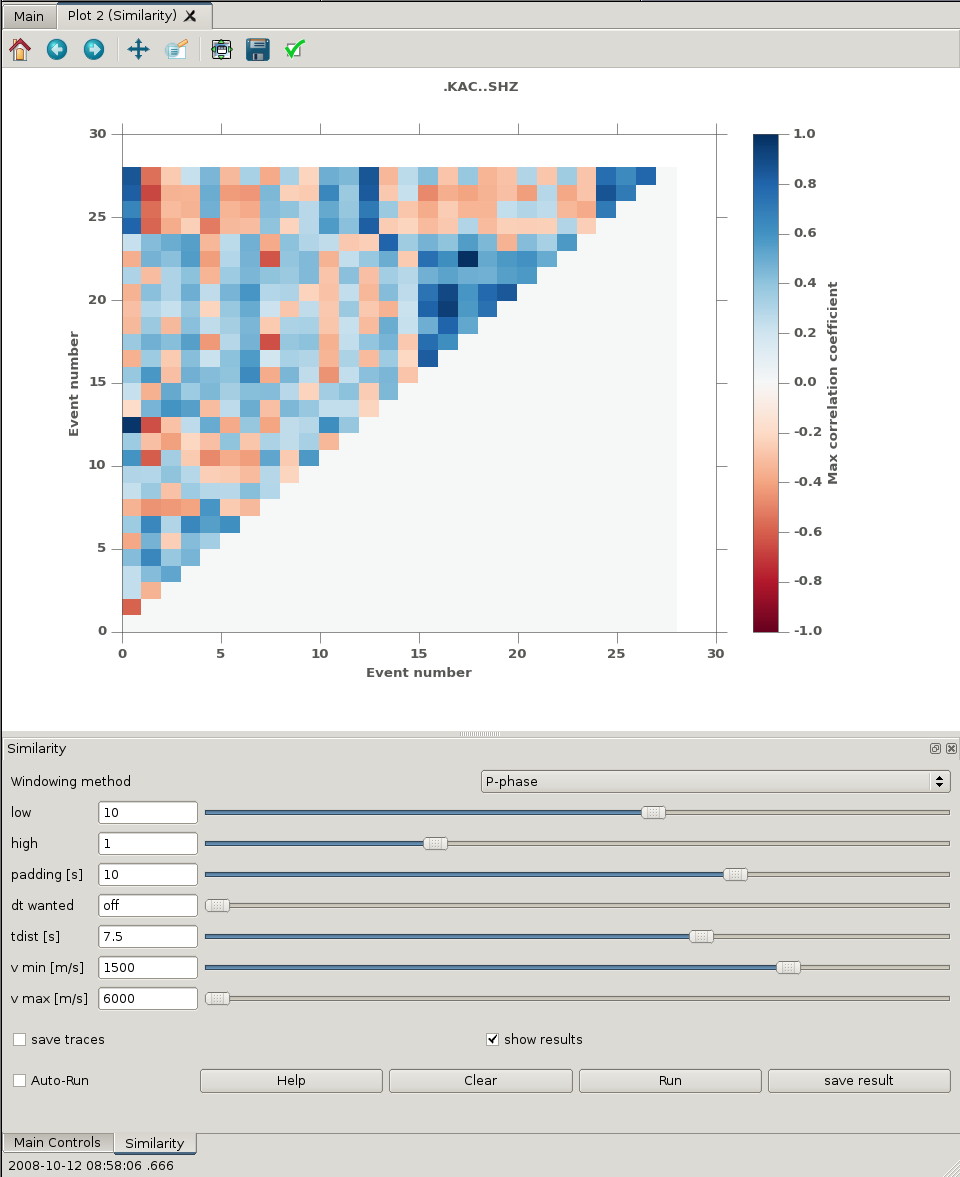
Cross correlate selected events. Results, including cross-correlation factor and time lags between maxima of the cross correlation can be stored in YAML format to ease later analysis.
directory: cc_matrix
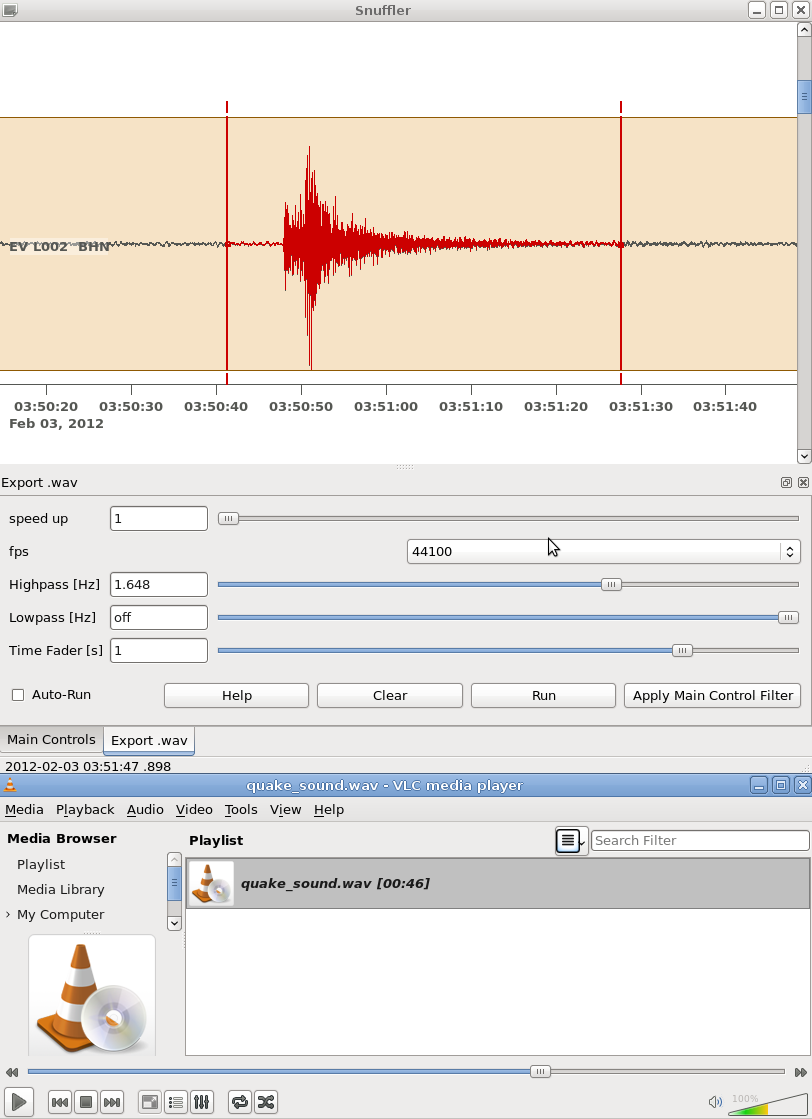
file: SeiSound.py
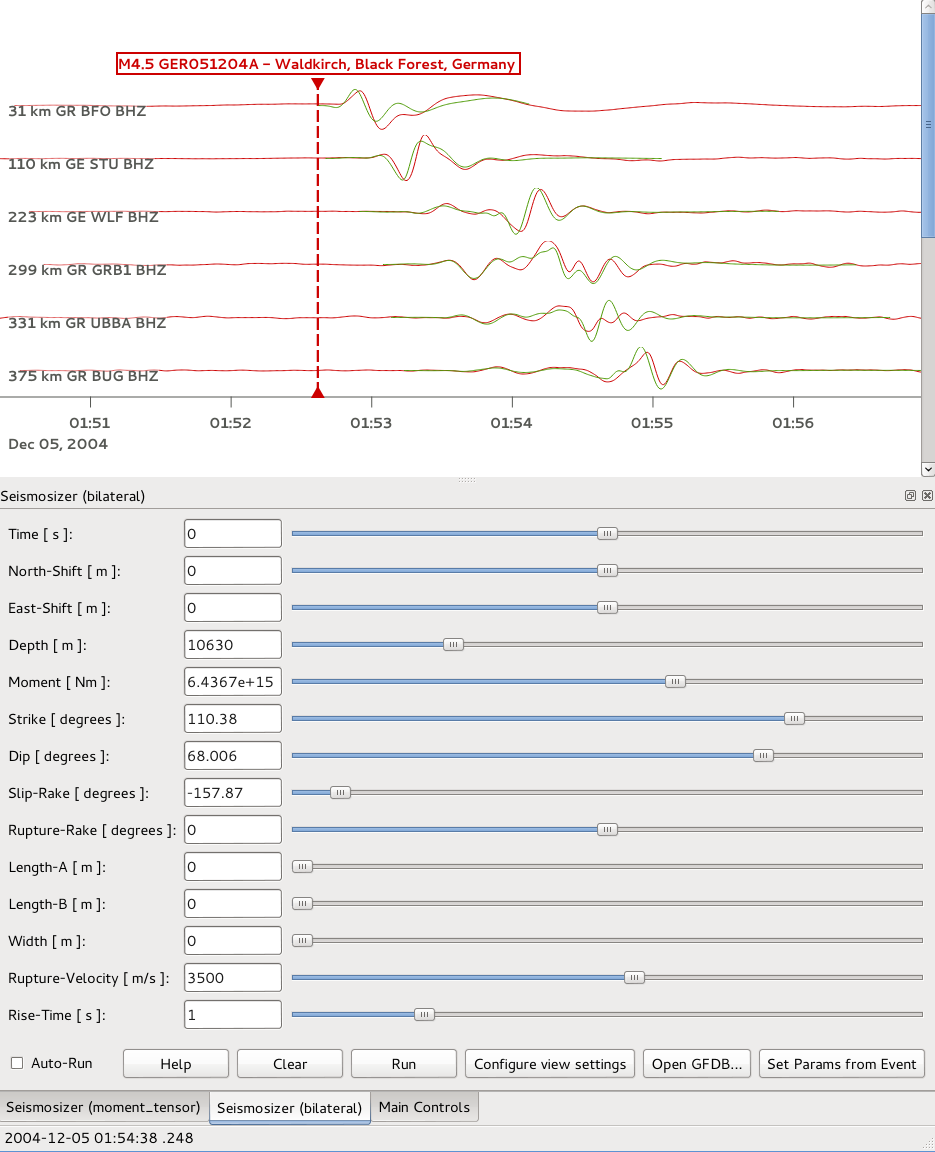
Calculate and show synthetic seismograms. The Kiwi Tools package must be installed for this to work.
file: kiwi_seismosizer.py
Plot time vs. magnitude
file: time_line.py
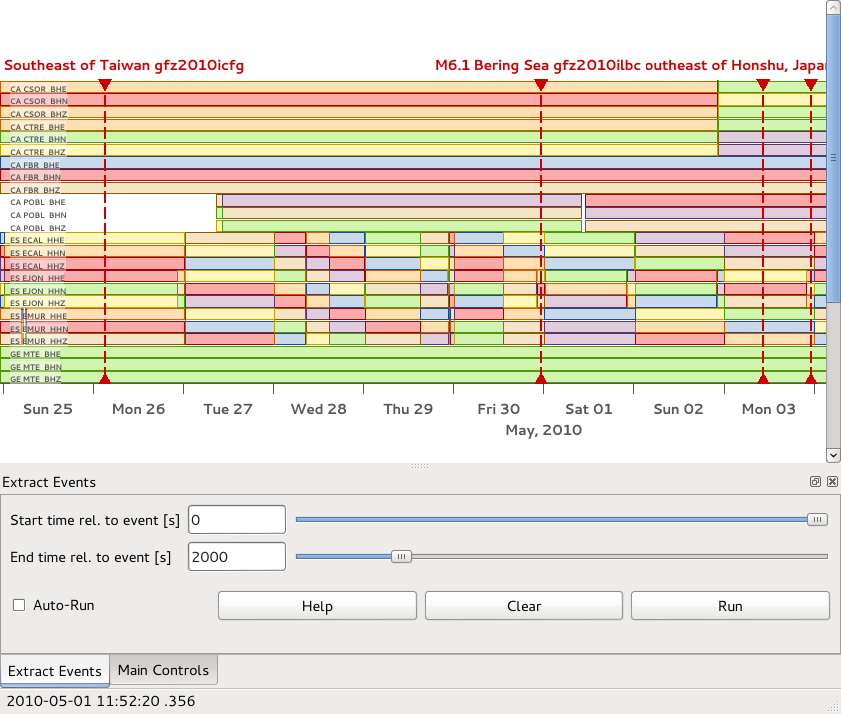
Save waveforms for time windows around selected events as MSEED. This is a hybrid Snuffling which can be run from the command-line as well.
file: extract_events.py
Export selected/visible waveforms as MSEED, ASCII, SAC or YAFF files.
file: export_waveforms.py
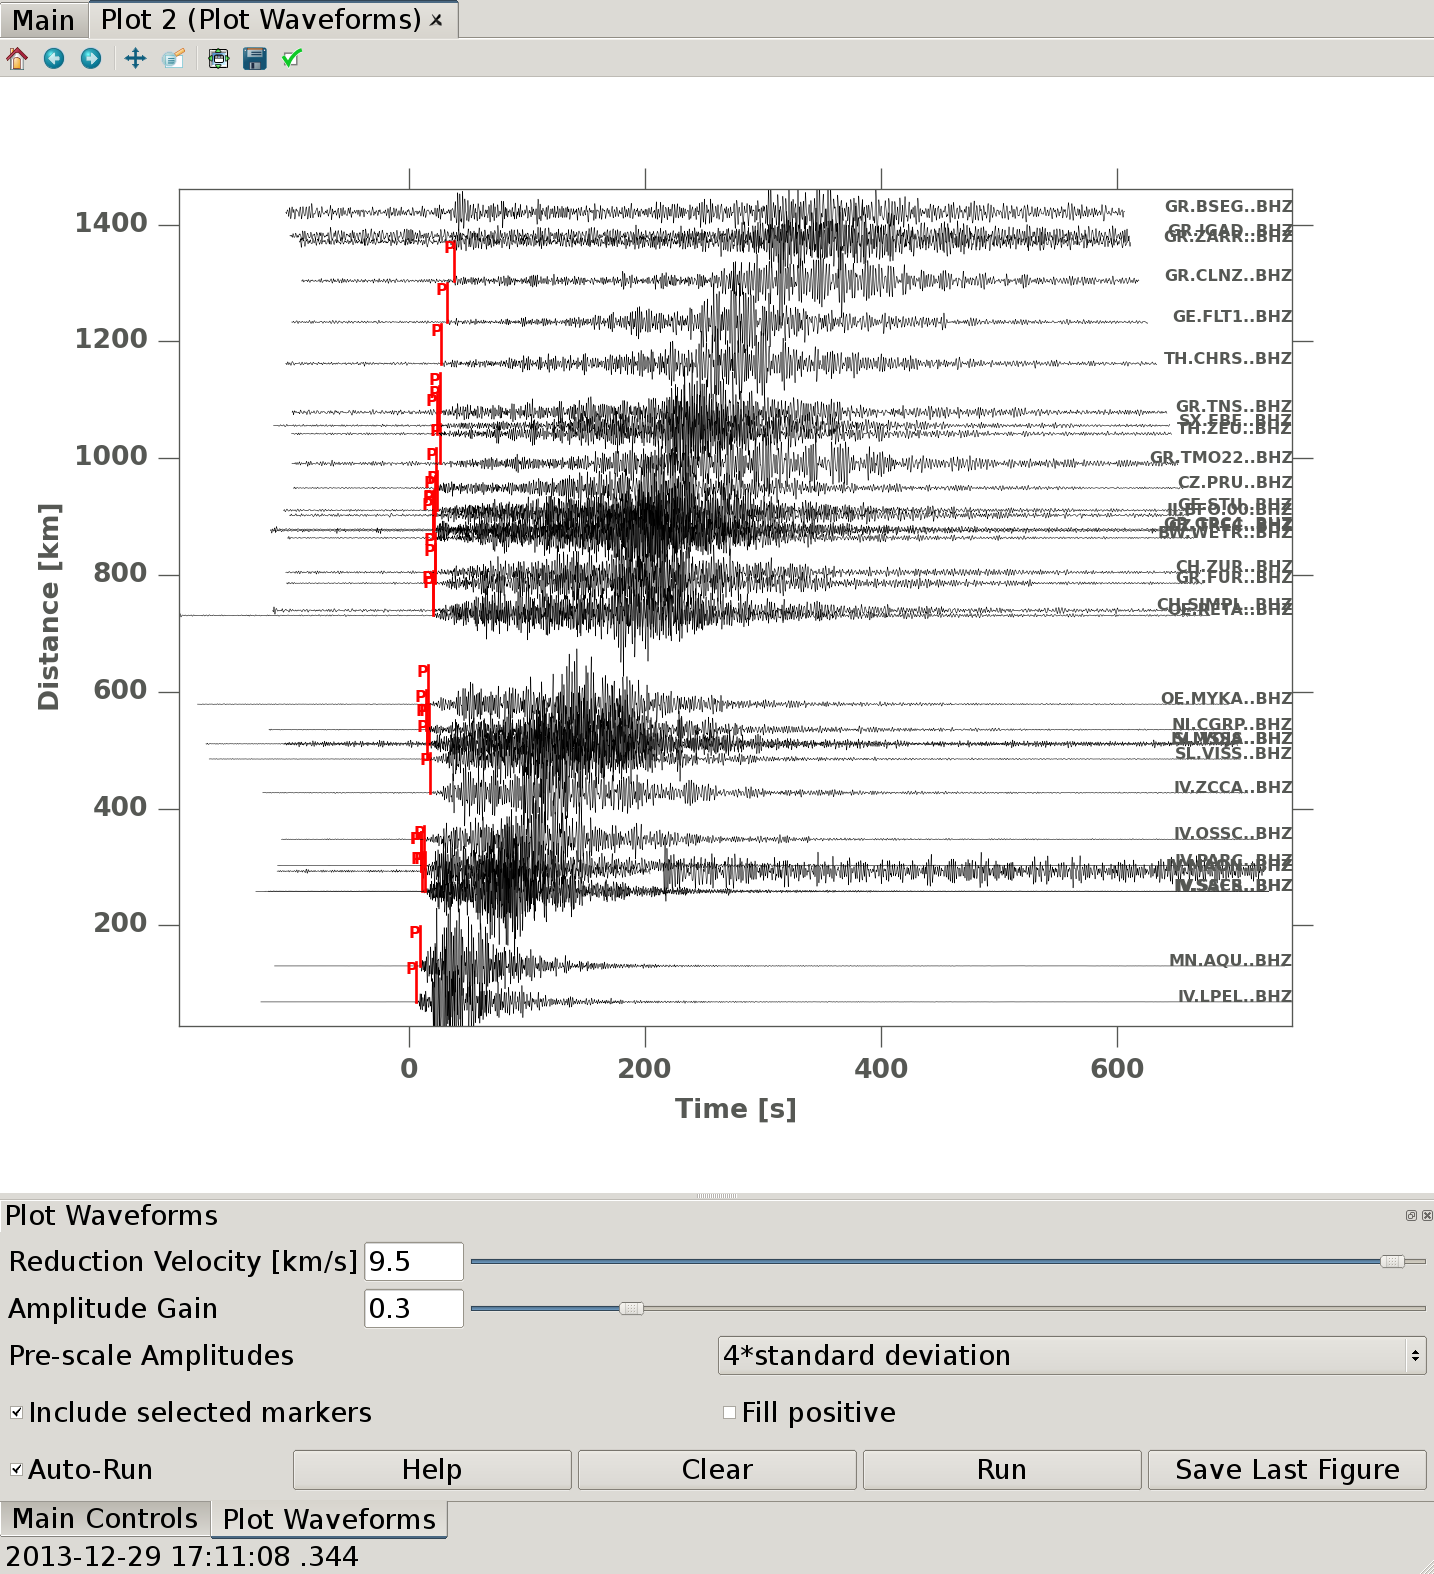
Applying a reduction velocity allows to 'shrink' the time domain. Figures can be exported in various image file formats like .png or .pdf. In order to improve the visual perception of small wiggles, positive amplitudes can be plotted in filled mode.
file: plot_traces.py
file: spectrogram.py
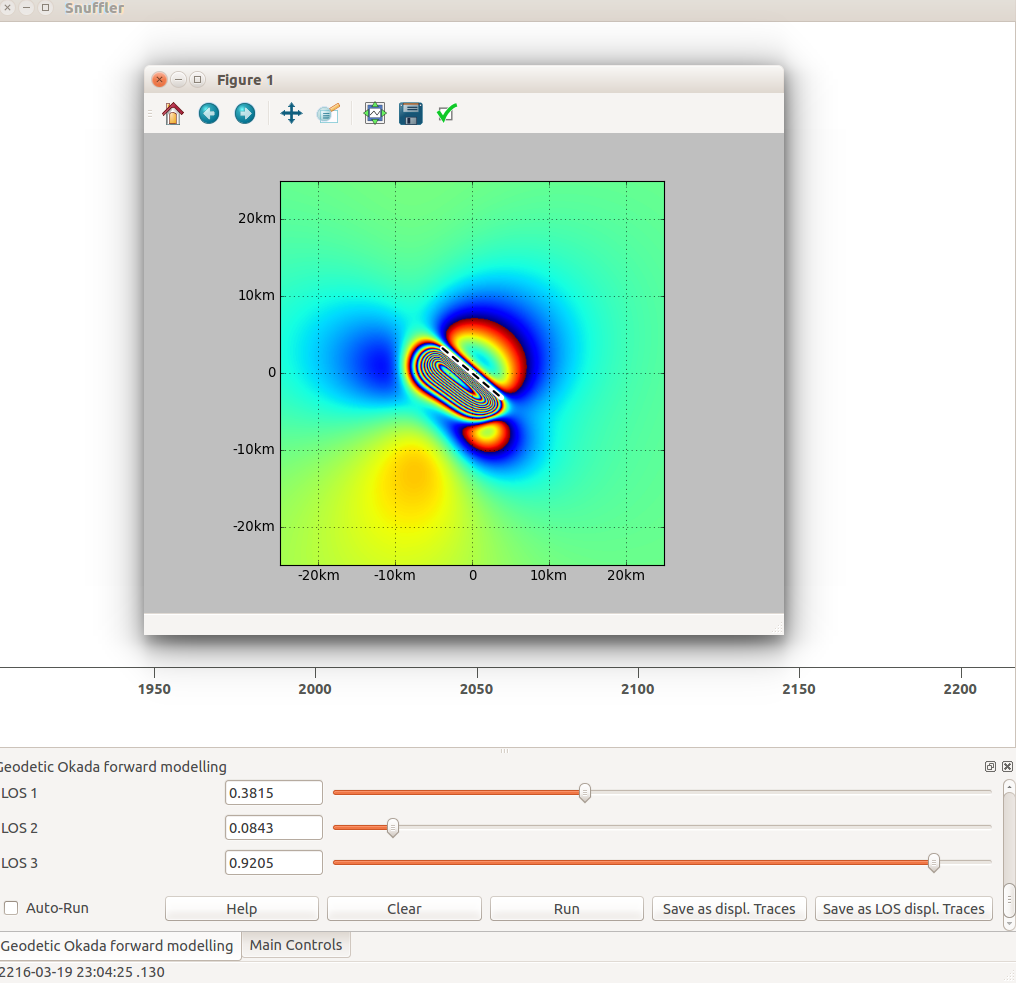
Visuialize and output of a data trace for a rectangular dislocation source in an elastic halfspace. You will need to go to the okada dir and type make in order to compile the C-Code.
directory: okada

