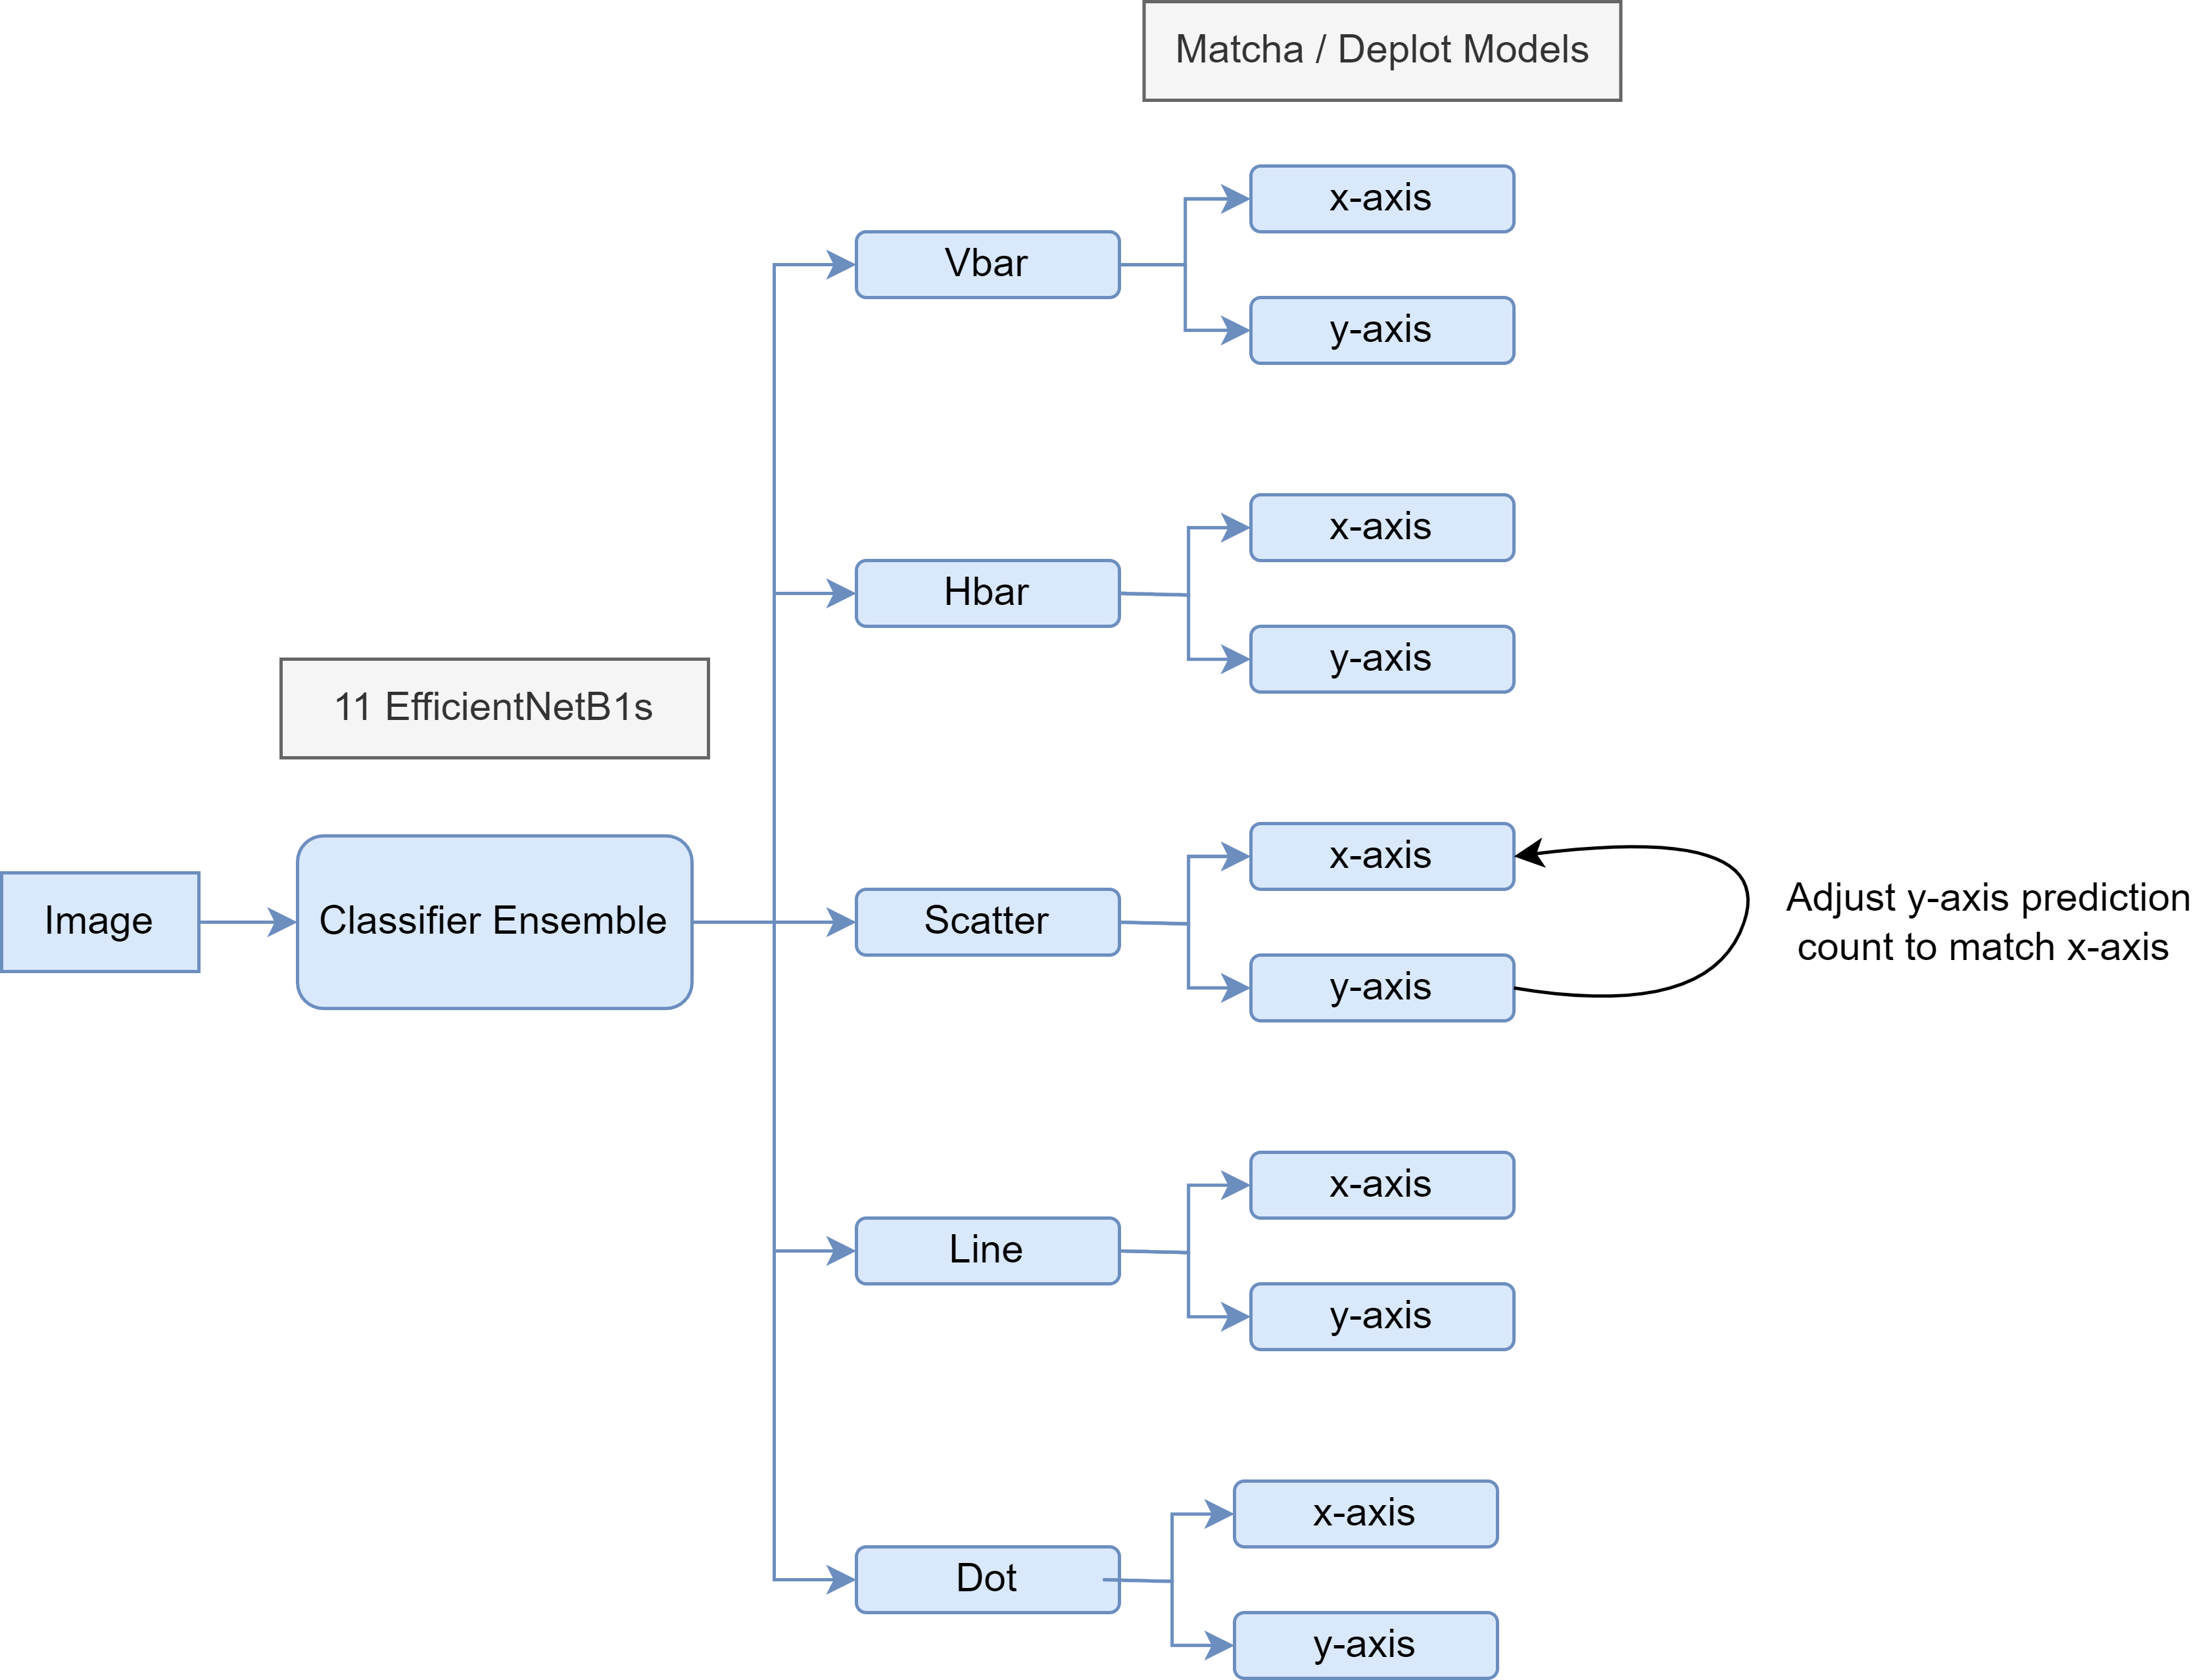
This repository contains code for the 38th place solution in the Benetech - Making Graphs Accessible competition on Kaggle.
Use SOTA models (effnet -> effnetv2)
- V2s are faster to train and more accurate
- See Thanh's 7th Place Solution
Do not overfit the training data and public LB.
- I used too many synthetically generated plots, and overfit the extracted data
Should have used more "real" plots
- Needed to use more diverse extracted datasets for training (ICDAR, ChartQA, PlotQA, etc.)
Could have used a more creative synthetic data generation process
- Extract X-Y data from Wikipedia data + glossary
- See Raja Biswas's 2nd Place Solution
Needed a better CV setup
- Use smaller models to test ideas and scale up in the end
- Set up a way to validate single models and ensembles early on (ie. add a valdiate.py file)
Classifier and Counting performance was not strong
- For a chart to be scored it had to be classified correctly, and have the right number of points
- Classification CV was ~95%, but other solutions were ~99.5% (they used more "real" plots)
Need to focus more on the ensemble
- Work on ensembles in local CV to find good combinations
- Look at the correlation between different high-performing models (and pick ones that are quite different)
- See 1st Place Solution of the Mechanisms of Action Competition
Best place in a Kaggle competition this far!
- Reduced precision of the data
- Trained a separate pix2struct model for each chart type and axis (10 models)
- Setup Torch-Lightning code to quickly test ideas
- Put together a plot generator
