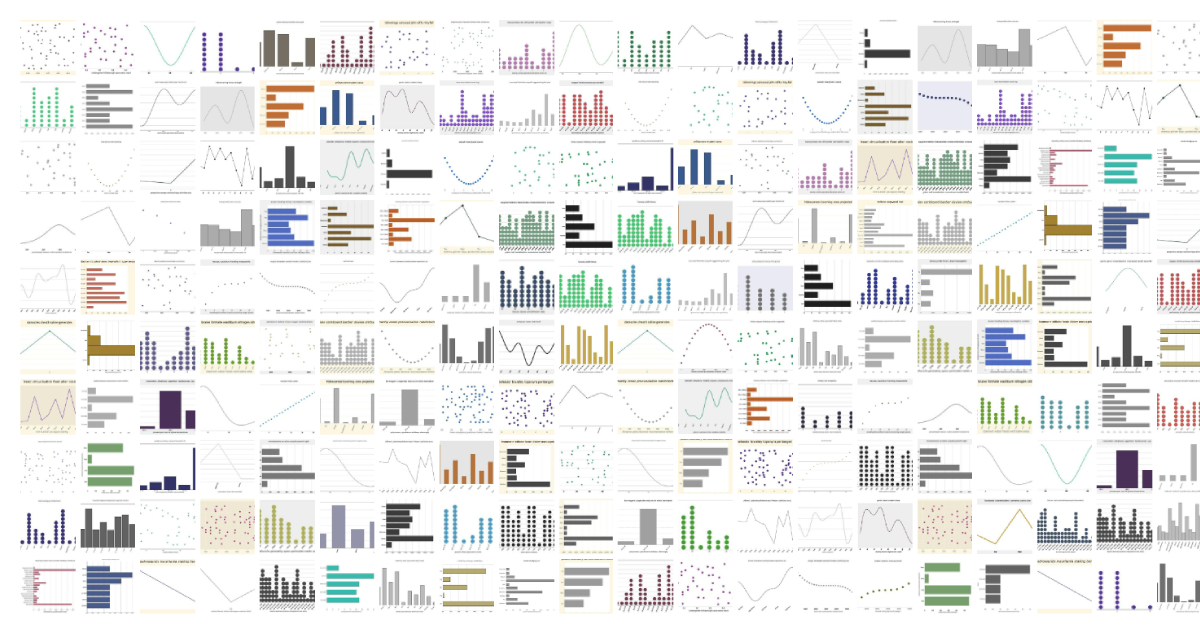
GenPlot
This repository contains code for GenPlot: Increasing the Scale and Diversity of Chart Derendering Data.
Getting Started
- Clone the repository
git clone https://github.com/brendanartley/GenPlot.git
- Navigate to repository
cd GenPlot
- Create a virtual environment
python -m venv venv
- Activate the virtual environment
source venv/bin/activate
- Install the required packages
pip install -r requirements.txt
Plot Generation
There are a number of command line arguments that can be use to customize the generation process. These are shown below, or simply run python generate.py -h to view them in the command line.
options:
  -h, --help            show this help message and exit
  --out_file OUT_FILE   Directory to save charts in. (default: ./graphs)
  --generate_n_imgs GENERATE_N_IMGS
                        Number of charts to generate. (default: 100000)
  --seed SEED           Seed used to generate data. (default: 9090)
  --ctype CTYPE         Flag to determine which graph to generate. (v, h, l, s, d) (default: v)
Here are some sample commands which can be used to generate 100,000 plots of each type.
python .\generate.py --generate_n_imgs=100_000 --ctype="v" --seed=9090 --out_file="./graphs_v"
python .\generate.py --generate_n_imgs=100_000 --ctype="h" --seed=9090 --out_file="./graphs_h"
python .\generate.py --generate_n_imgs=100_000 --ctype="l" --seed=9090 --out_file="./graphs_l"
python .\generate.py --generate_n_imgs=100_000 --ctype="s" --seed=9090 --out_file="./graphs_s"
python .\generate.py --generate_n_imgs=100_000 --ctype="d" --seed=9090 --out_file="./graphs_d"
