cmaps
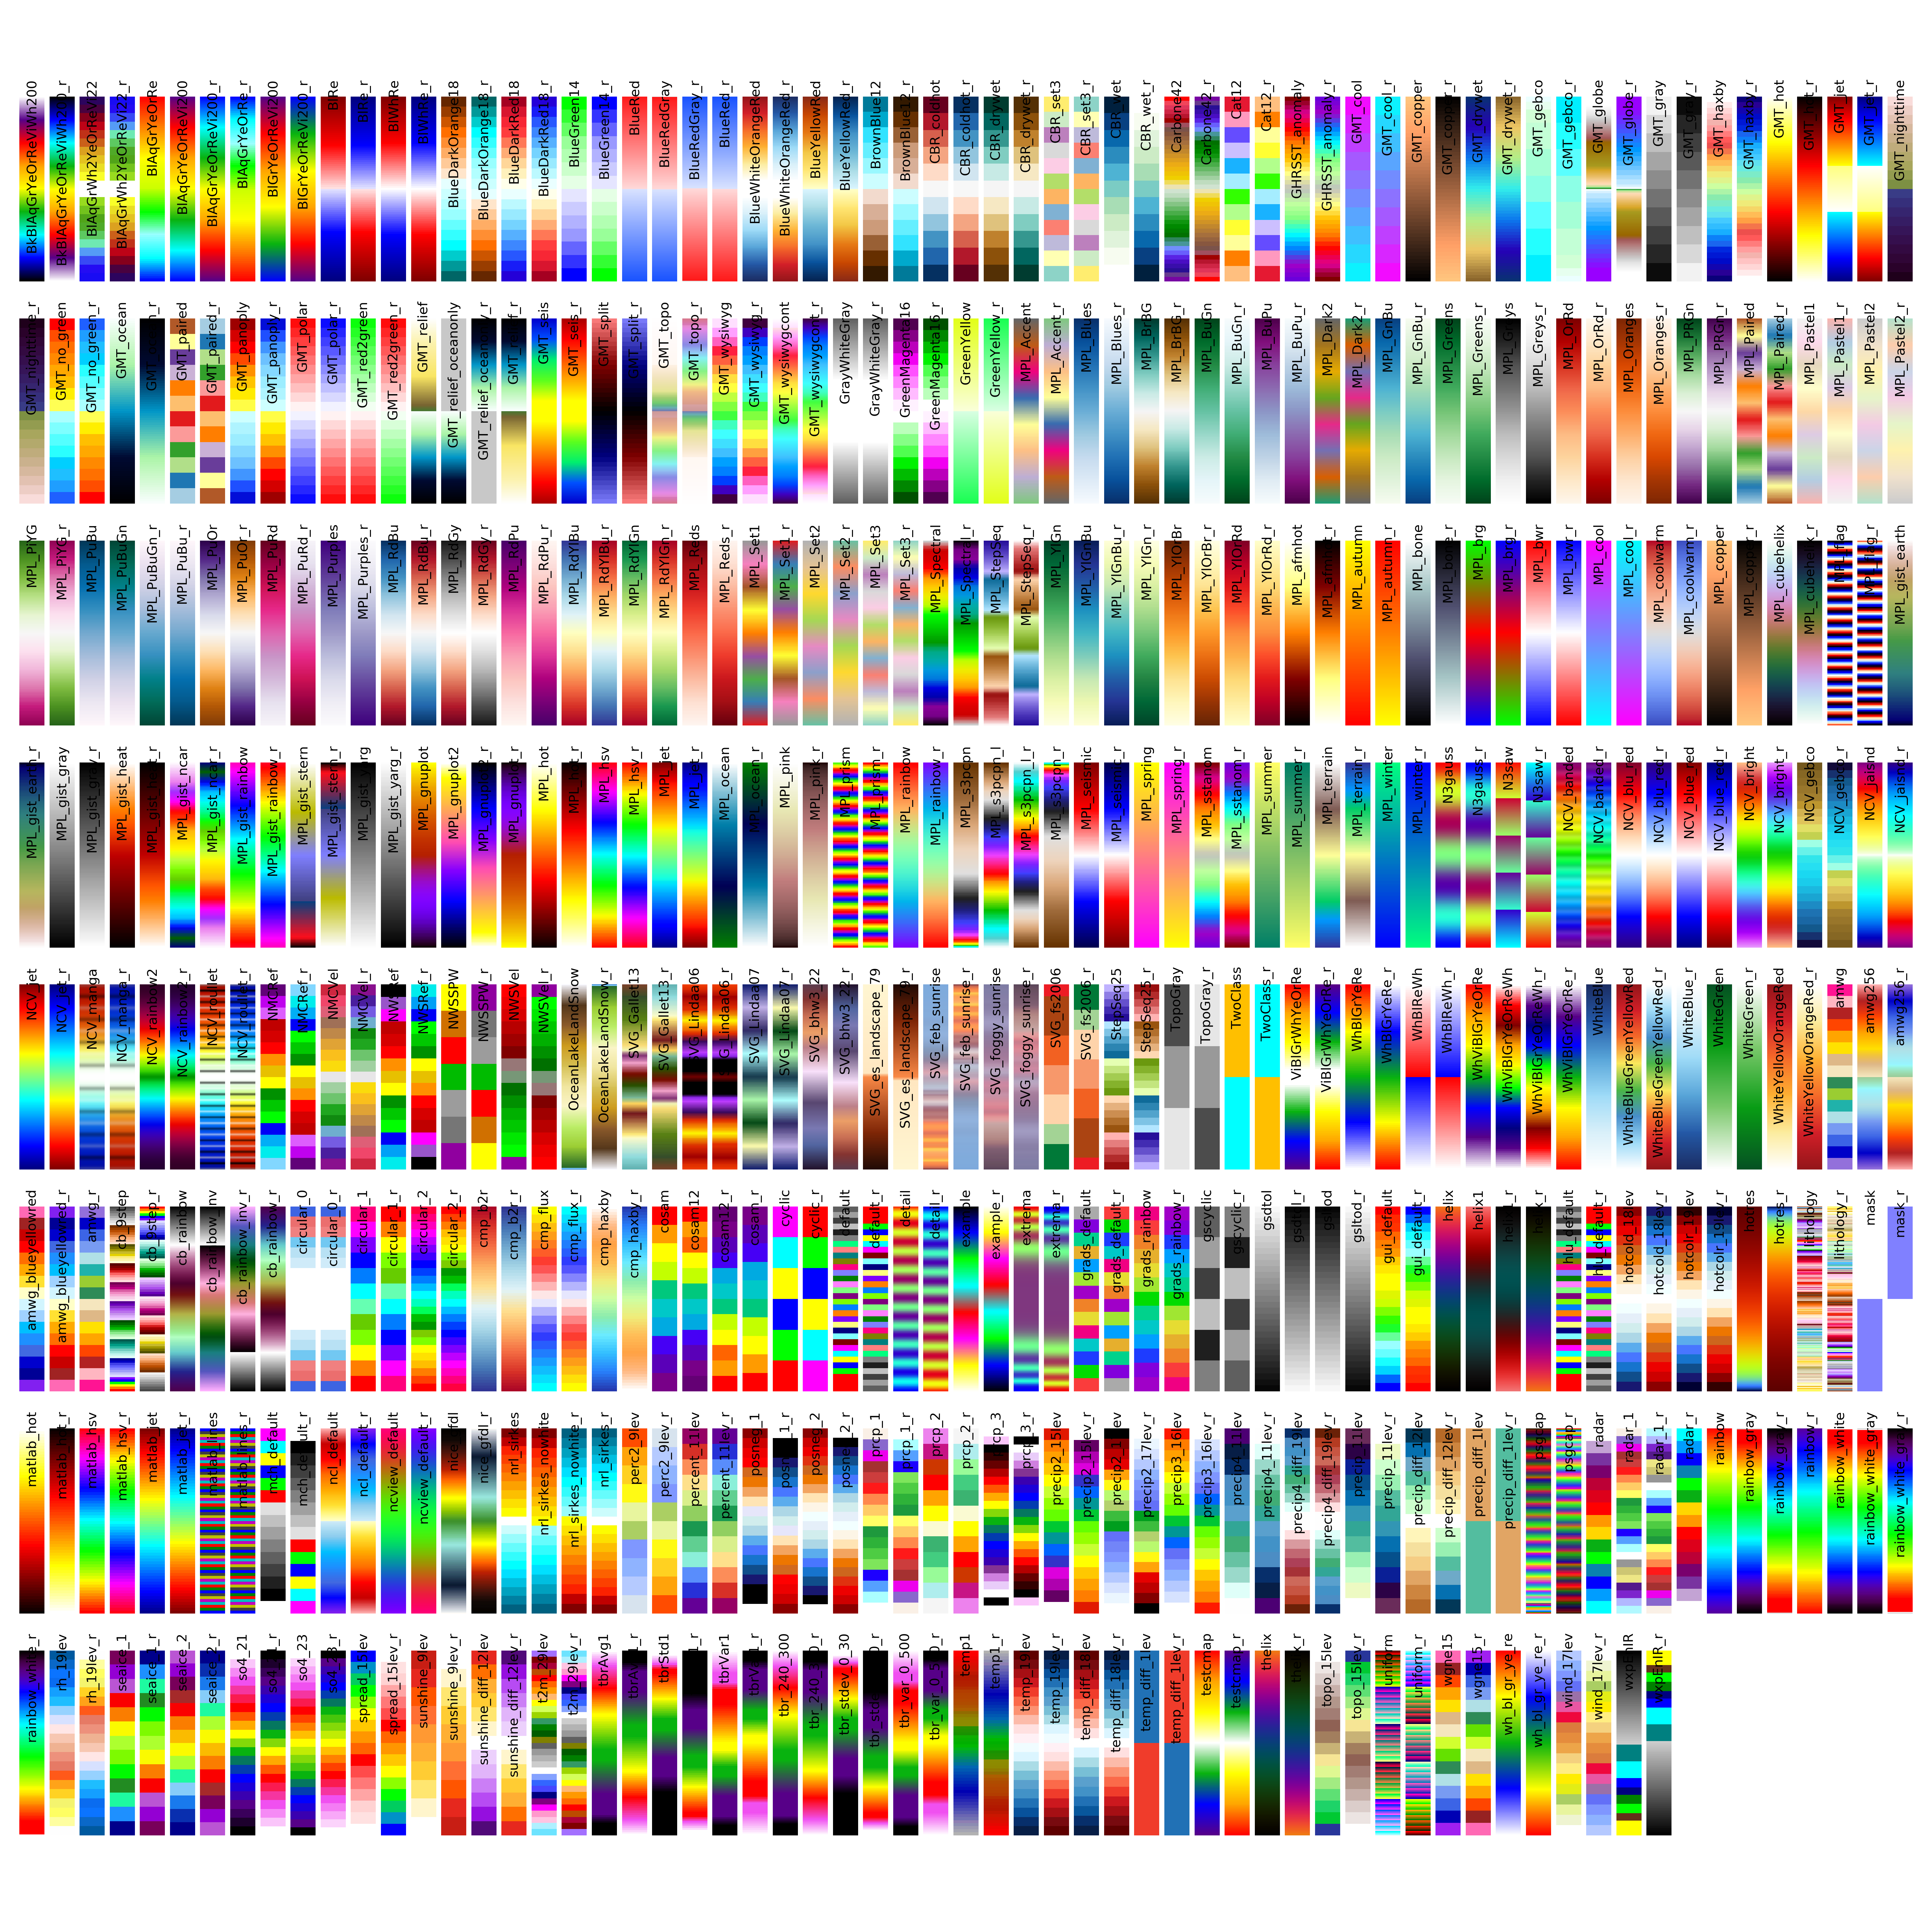
Make it easier to use user defined colormaps in matplotlib. Default colormaps are from NCL website.
Users can define a environmental variable CMAP_DIR pointing to the folder containing the self-defined rgb files.
Installation:
pip install https://github.com/hhuangwx/cmaps/archive/master.zip
or:
git clone https://github.com/hhuangwx/cmaps.git
cd cmaps
python setup.py install
Usage:
import matplotlib.pyplot as plt
import cmaps
import numpy as np

x = y = np.arange(-3.0, 3.01, 0.05)
X, Y = np.meshgrid(x, y)

sigmax = sigmay = 1.0
mux = muy = sigmaxy=0.0

Xmu = X-mux
Ymu = Y-muy

rho = sigmaxy/(sigmax*sigmay)
z = Xmu**2/sigmax**2 + Ymu**2/sigmay**2 - 2*rho*Xmu*Ymu/(sigmax*sigmay)
denom = 2*np.pi*sigmax*sigmay*np.sqrt(1-rho**2)
Z = np.exp(-z/(2*(1-rho**2))) / denom

plt.pcolormesh(X,Y,Z,cmap=cmaps.WhiteBlueGreenYellowRed)
plt.colorbar()
List the colormaps using the code in the examples:
import cmaps
import numpy as np
import inspect

import matplotlib.pyplot as plt
import matplotlib
matplotlib.rc('text', usetex=False)


def list_cmaps():
    attributes = inspect.getmembers(cmaps, lambda _: not (inspect.isroutine(_)))
    colors = [_[0] for _ in attributes if
              not (_[0].startswith('__') and _[0].endswith('__'))]
    return colors


if __name__ == '__main__':
    color = list_cmaps()

    a = np.outer(np.arange(0, 1, 0.001), np.ones(10))
    plt.figure(figsize=(20, 20))
    plt.subplots_adjust(top=0.95, bottom=0.05, left=0.01, right=0.99)
    ncmaps = len(color)
    nrows = 8
    for i, k in enumerate(color):
        plt.subplot(nrows, ncmaps // nrows + 1, i + 1)
        plt.axis('off')
        plt.imshow(a, aspect='auto', cmap=getattr(cmaps, k), origin='lower')
        plt.title(k, rotation=90, fontsize=10)
        plt.title(k, fontsize=10)
    plt.savefig('colormaps.png', dpi=300)
