NOTE: The functions in this repository have been incorporated into highdim, a more comprehensive set of Matlab functions for multidimensional statistics.
Matlab code for non-parametrically testing whether two multidimensional samples were drawn from the same parent distribution. One function implements Fasano & Franceschini's generalization [1] to two dimensions (kstest2d.m) of the Kolmorogov-Smirnov test, while the second implements Aslan & Zech's and Szekely & Rizzo's test based on an analogy to statistical energy [2], which is minimized when the two samples are drawn from the same parent distribution (minentest.m). In both cases, the analytic distribution of the statistic is unknown, and approximations are used for statistical testing. For the K-S test, I use an approximation due to Press et al. [3]. For the energy test, p-values are obtained via permutation of the aggregated samples.
The K-S test currently only works for two-dimensional data, but the minimum energy tests accept n-dimensional inputs (although significance testing may become prohibitively expensive).
Both functions are written as two-sample tests, although modifying the minimum energy test for testing goodness-of-fit is straightforward if it is possible to sample from the distribution one is interested in testing the data against (detailed in reference [2]).
- Fasano, G, Franceschini, A (1987). A multidimensional version of the Kolmorogov-Smirnov test. Mon Not R Astr Soc, 225:155-70
- Aslan, B, Zech, G (2005). Statistical energy as a tool for binning-free, multivariate goodness-of-fit tests, two sample comparison and unfolding. Nuc Instr and Meth in Phys Res A, 537: 626-36
- Szekely, G, Rizzo, M (2014) Energy statistics: A class of statistics based on distances. J Stat Planning & Inference 143: 1249-1272
- Press et al. (1992). Numerical Recipes in C. Cambridge University Press
Install the functions under your Matlab path. The following examples should get you started. ####Difference in multivariate means:
x = randn(100,2); y = bsxfun(@plus,[.2 .2],randn(100,2));
[pm,e_n] = minentest(x,y) % 2-d minimum energy test
[pk,D] = kstest2d(x,y) % 2-d K-S test
[pt,T2] = hotell2(x,y) % Hotelling T^2 test
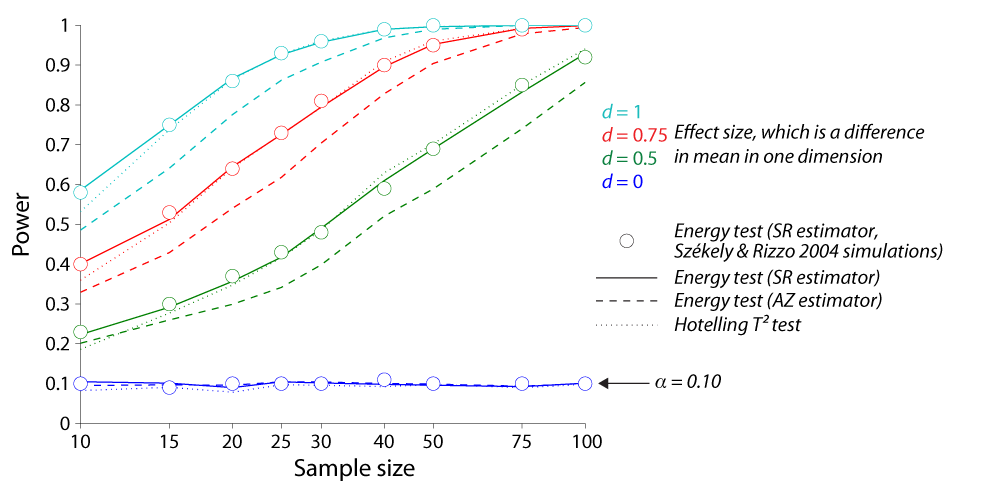
The following figure shows the results of some monte-carlo simulations exploring power when comparing 2-d samples from the same distribution (Gaussian, unit standard deviations), with one set of data with a different mean along one dimension. Szekely & Rizzo's energy test dominates Aslan & Zech's, and performs as well as the parametric Hotelling T^2 test, suggesting that Szekely & Rizzo's energy test is suitable even when one knows that the samples are multivariate Guassian.
 ####Difference in distributions:
x = randn(100,2); y = log(abs(randn(100,2)));
[pm,e_n] = minentest(x,y)
[pk,D] = kstest2d(x,y)
The following figure shows the results of some monte-carlo simulations exploring power when comparing 2-d samples from different distributions. I sampled from four different distributions (Px in each quadrant of the figure) and ran two tests: 1) whether this sample came from the same parent distribution as another sample from the same distribution (Px compared to Px) and 2) whether this sample came from the same parent distribution as another sample of the same size drawn from standard normal (Px compared to Py). Both tests have good rejection power, although the 2-d K-S test performs poorly in one case, and has a slightly inflated Type I error rate at all tested sample sizes (the p-value is approximate, so perhaps this is unsurprising). Details follow the figure.
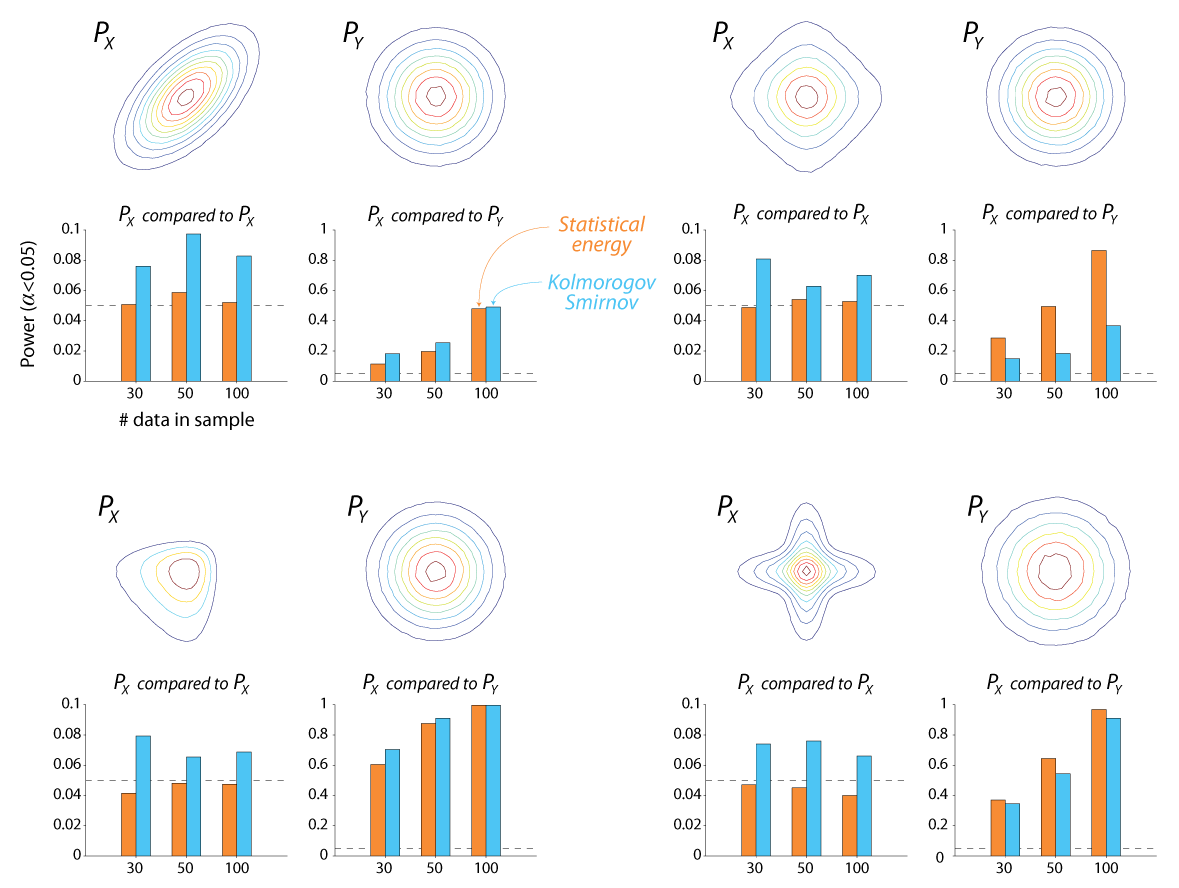
1000 simulations were run for each comparison at each sample length. Py in each case was a Gaussian with zero mean and identity covariance matrix. Starting from the upper left and moving clockwise, Px was drawn from: 1) zero-mean Gaussian with unit variances and covariances = 0.6; 2) Student's t-distribution with 2 degrees of freedom, 3) natural log of the absolute value of a zero-mean Gaussian with an identity covariance matrix; 4) samples from two zero-mean Gaussians with variances scaled to give a non-circular distribution.
Copyright (c) 2014 Brian Lau brian.lau@upmc.fr, see LICENSE