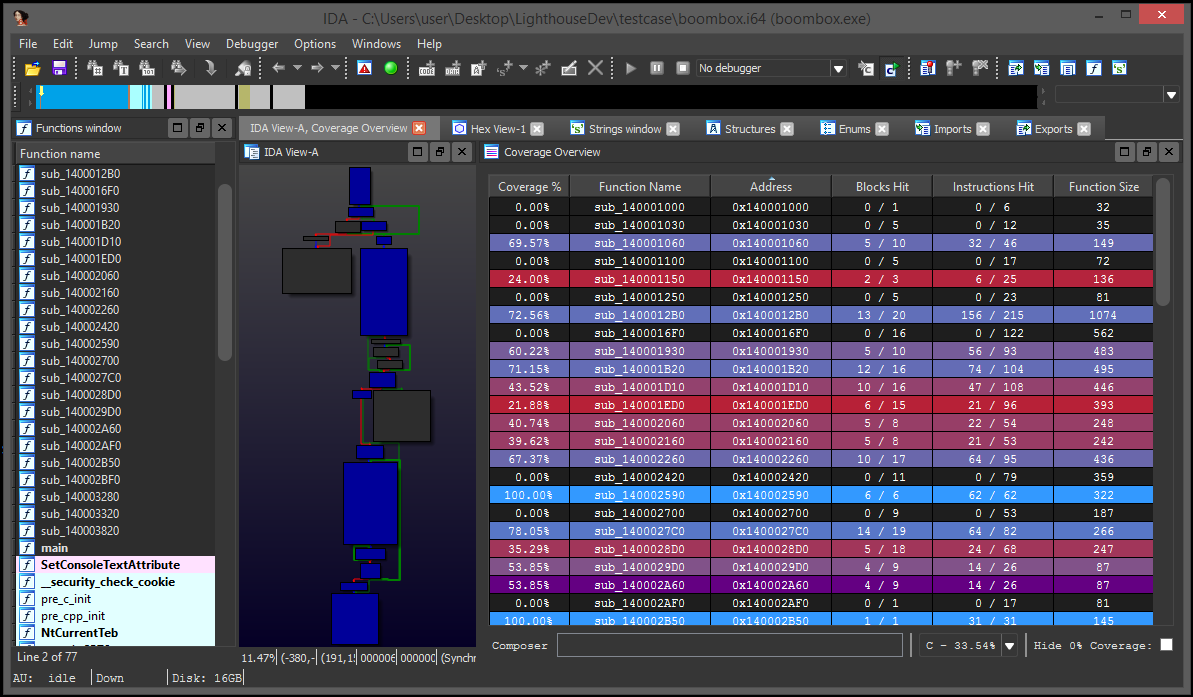
Lighthouse is a code coverage plugin for IDA Pro. The plugin leverages IDA as a platform to map, explore, and visualize externally collected code coverage data when symbols or source may not be available for a given binary.
This plugin is labeled only as a prototype and IDA / Qt code example for the community.
Special thanks to @0vercl0k for the inspiration.
- v0.7 -- Frida, C++ demangling, context menu, function prefixing, tweaks, bugfixes.
- v0.6 -- Intel pintool, cyclomatic complexity, batch load, bugfixes.
- v0.5 -- Search, IDA 7 support, many improvements, stability.
- v0.4 -- Most compute is now asynchronous, bugfixes.
- v0.3 -- Coverage composition, interactive composing shell.
- v0.2 -- Multifile support, performance improvements, bugfixes.
- v0.1 -- Initial release
Install Lighthouse into the IDA plugins folder.
- Copy the contents of the
pluginfolder to the IDA plugins folder- On Windows, the folder is at
C:\Program Files (x86)\IDA 6.8\plugins - On MacOS, the folder is at
/Applications/IDA\ Pro\ 6.8/idaq.app/Contents/MacOS/plugins - On Linux, the folder may be at
/opt/IDA/plugins/
- On Windows, the folder is at
The plugin is compatible with IDA Pro 6.8 --> 7.0 on Windows, MacOS, and Linux.
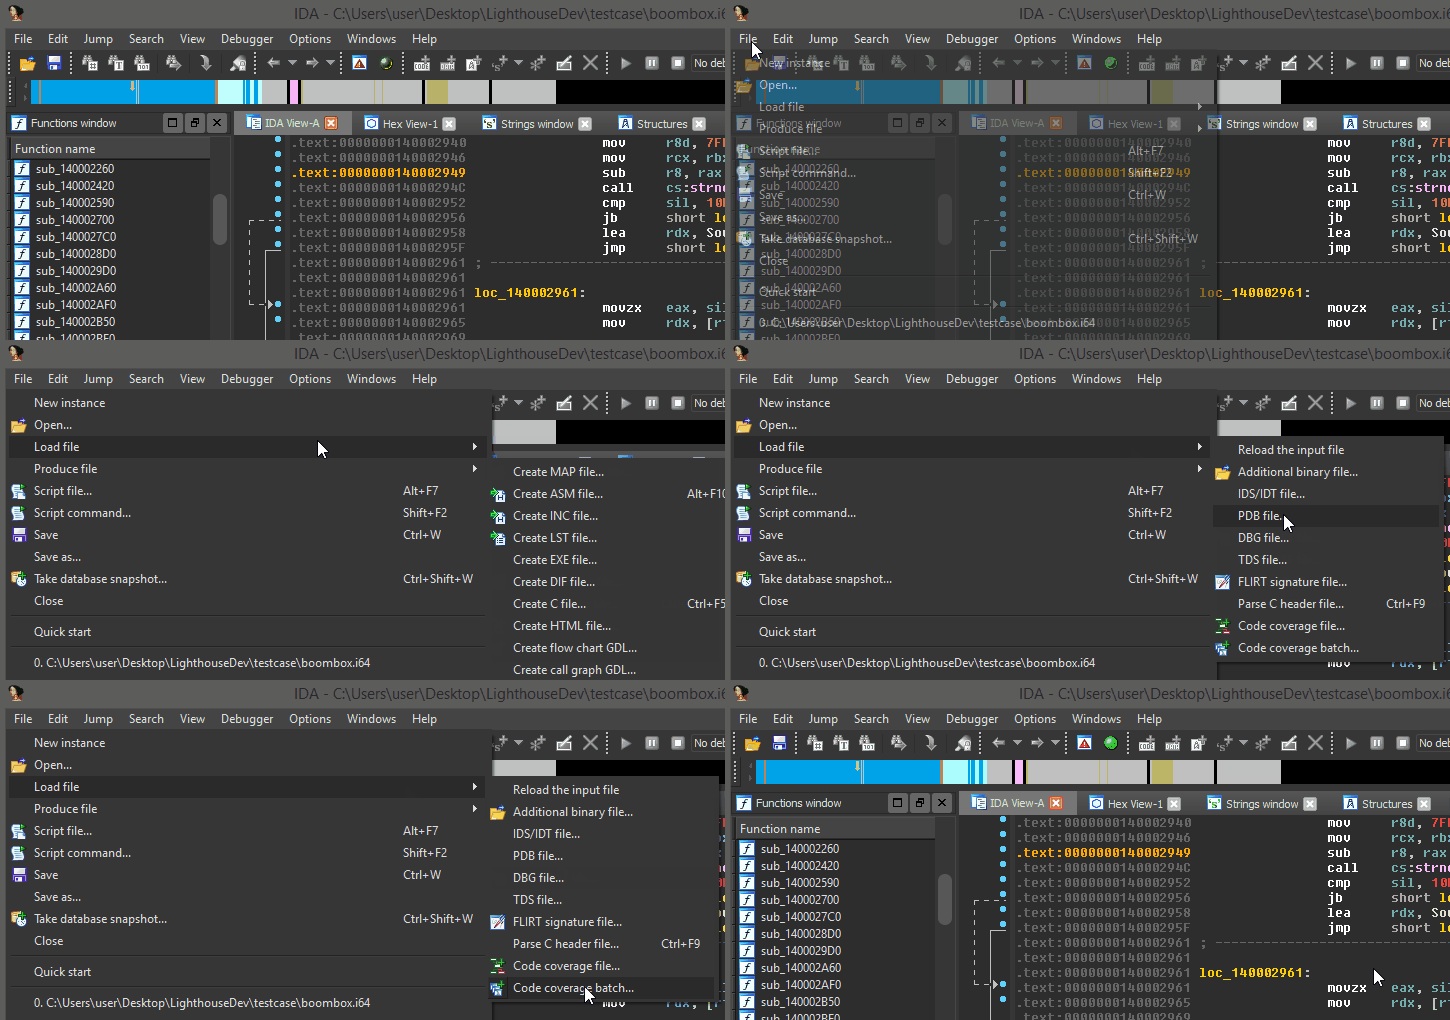
Lighthouse loads automatically when an IDB is opened, installing a handful of menu entries into the IDA interface.
These are the entry points for a user to load and view coverage data.
- File --> Load file --> Code coverage file...
- File --> Load file --> Code coverage batch...
- View --> Open subviews --> Coverage Overview
Batch load can quickly aggregate hundreds (thousands?) of collected coverage files into a single composite at load time.
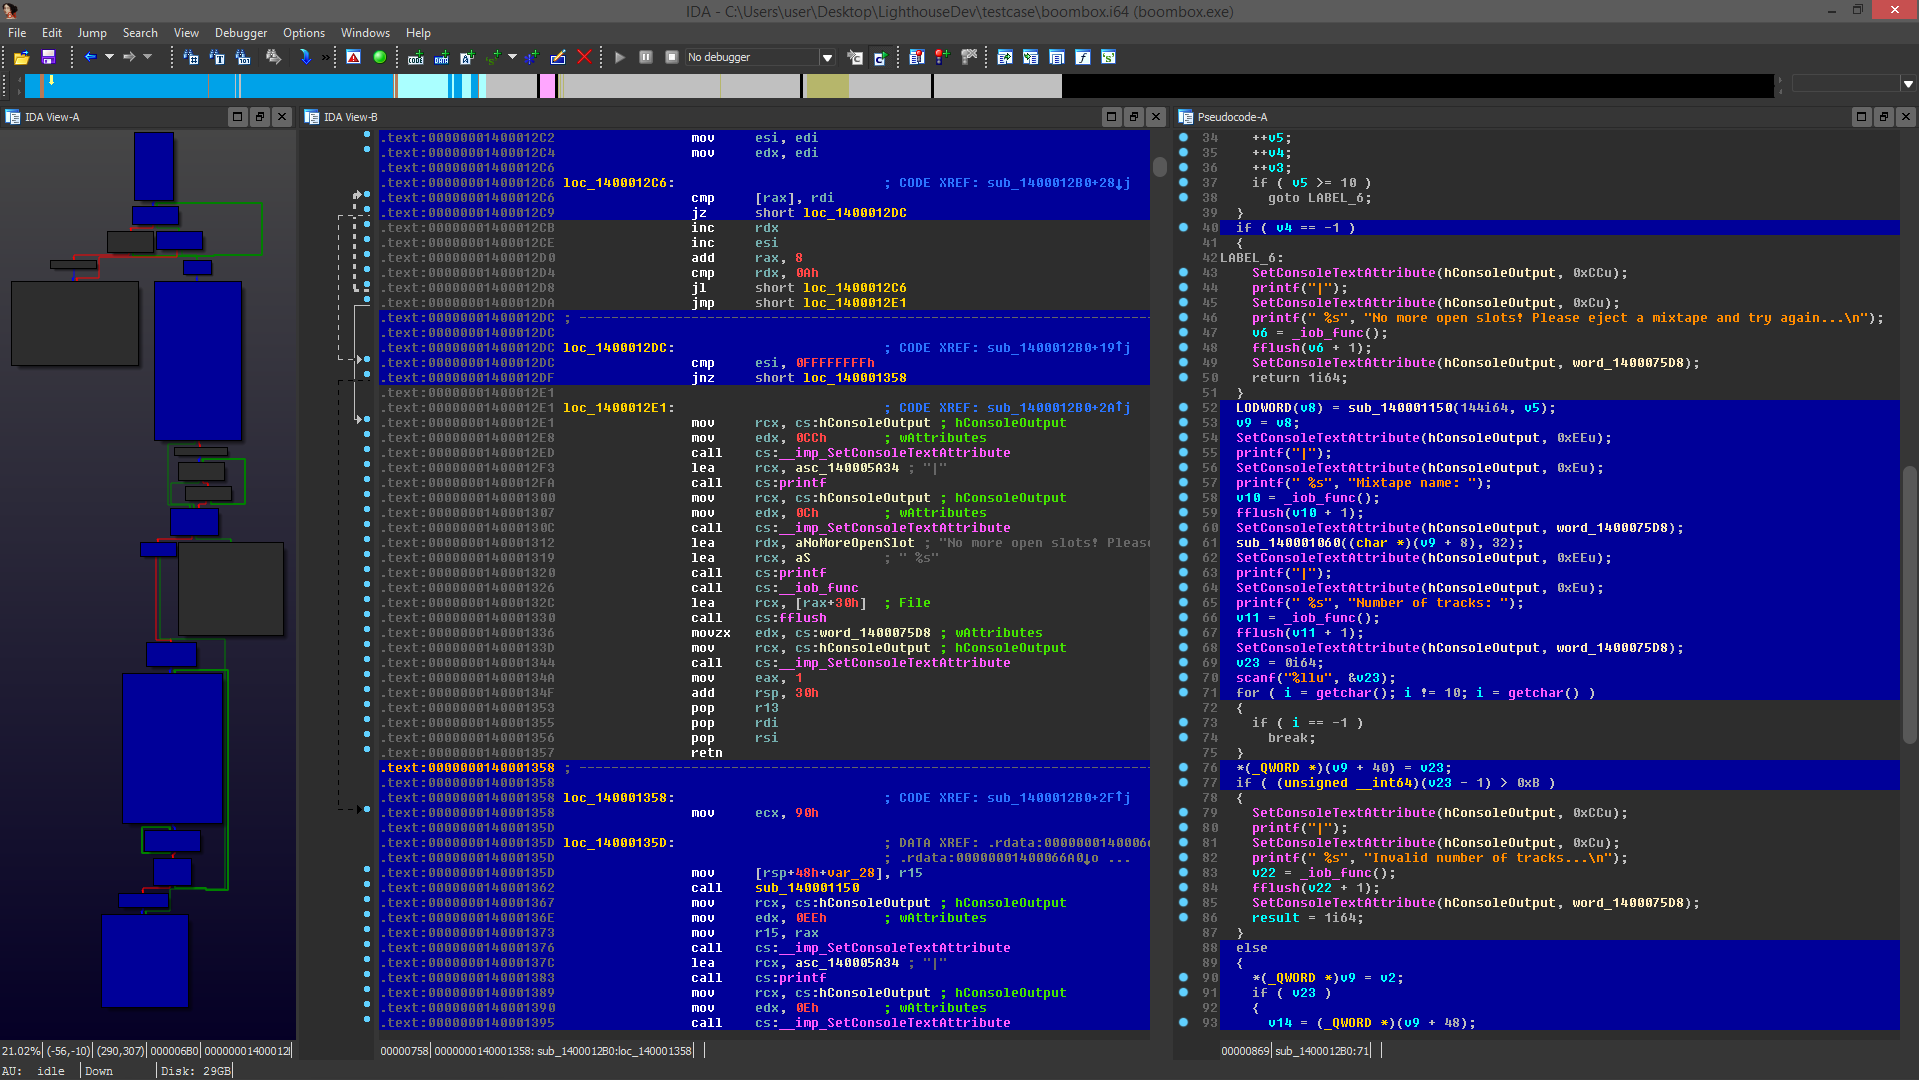
Lighthouse 'paints' the active coverage data across the three major IDA views as applicable. Specifically, the Disassembly, Graph, and Pseudocode views.
The Coverage Overview is a dockable widget that provides a function level view of the active coverage data for the database.
This table can be sorted by column, and entries can be double clicked to jump to their corresponding disassembly.
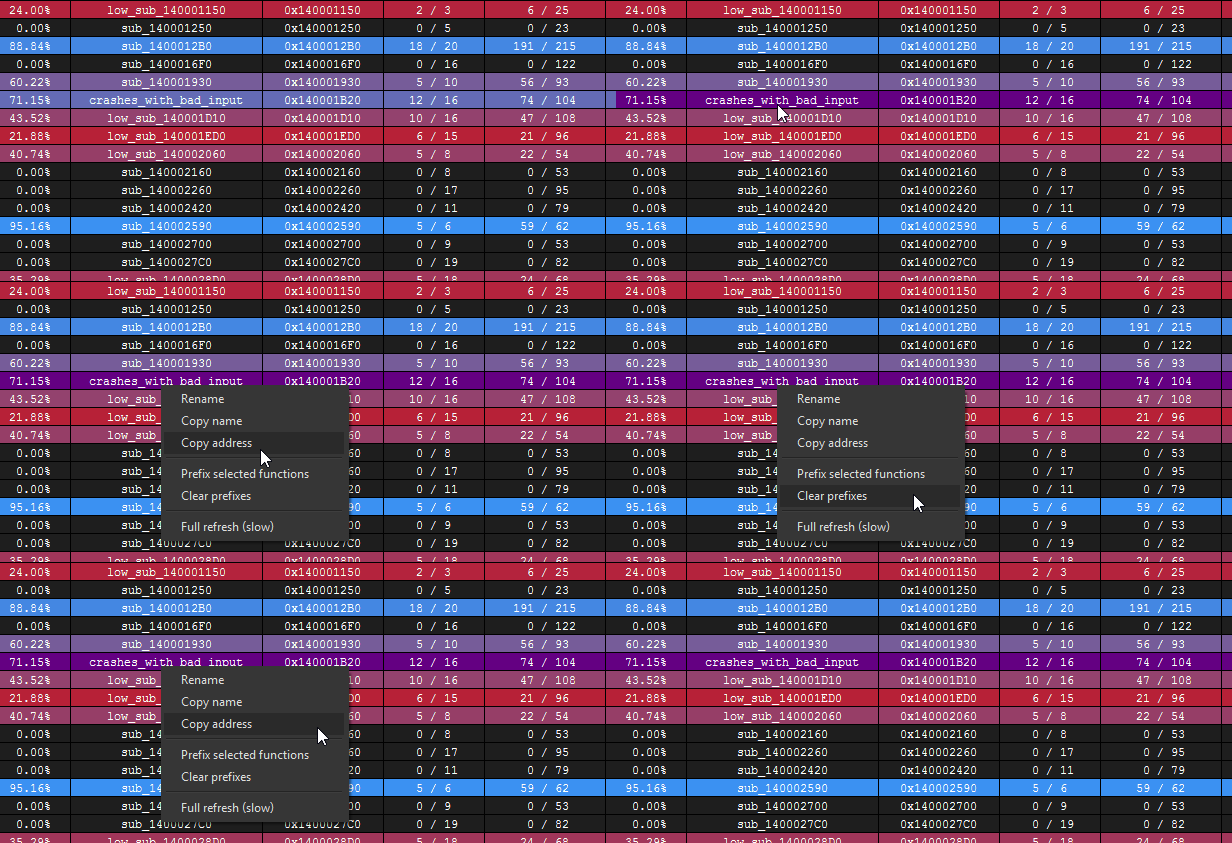
Right clicking the table in the Coverage Overview will produce a context menu with a few basic amenities.
These actions can be used to quickly manipulate or interact with entries in the table.
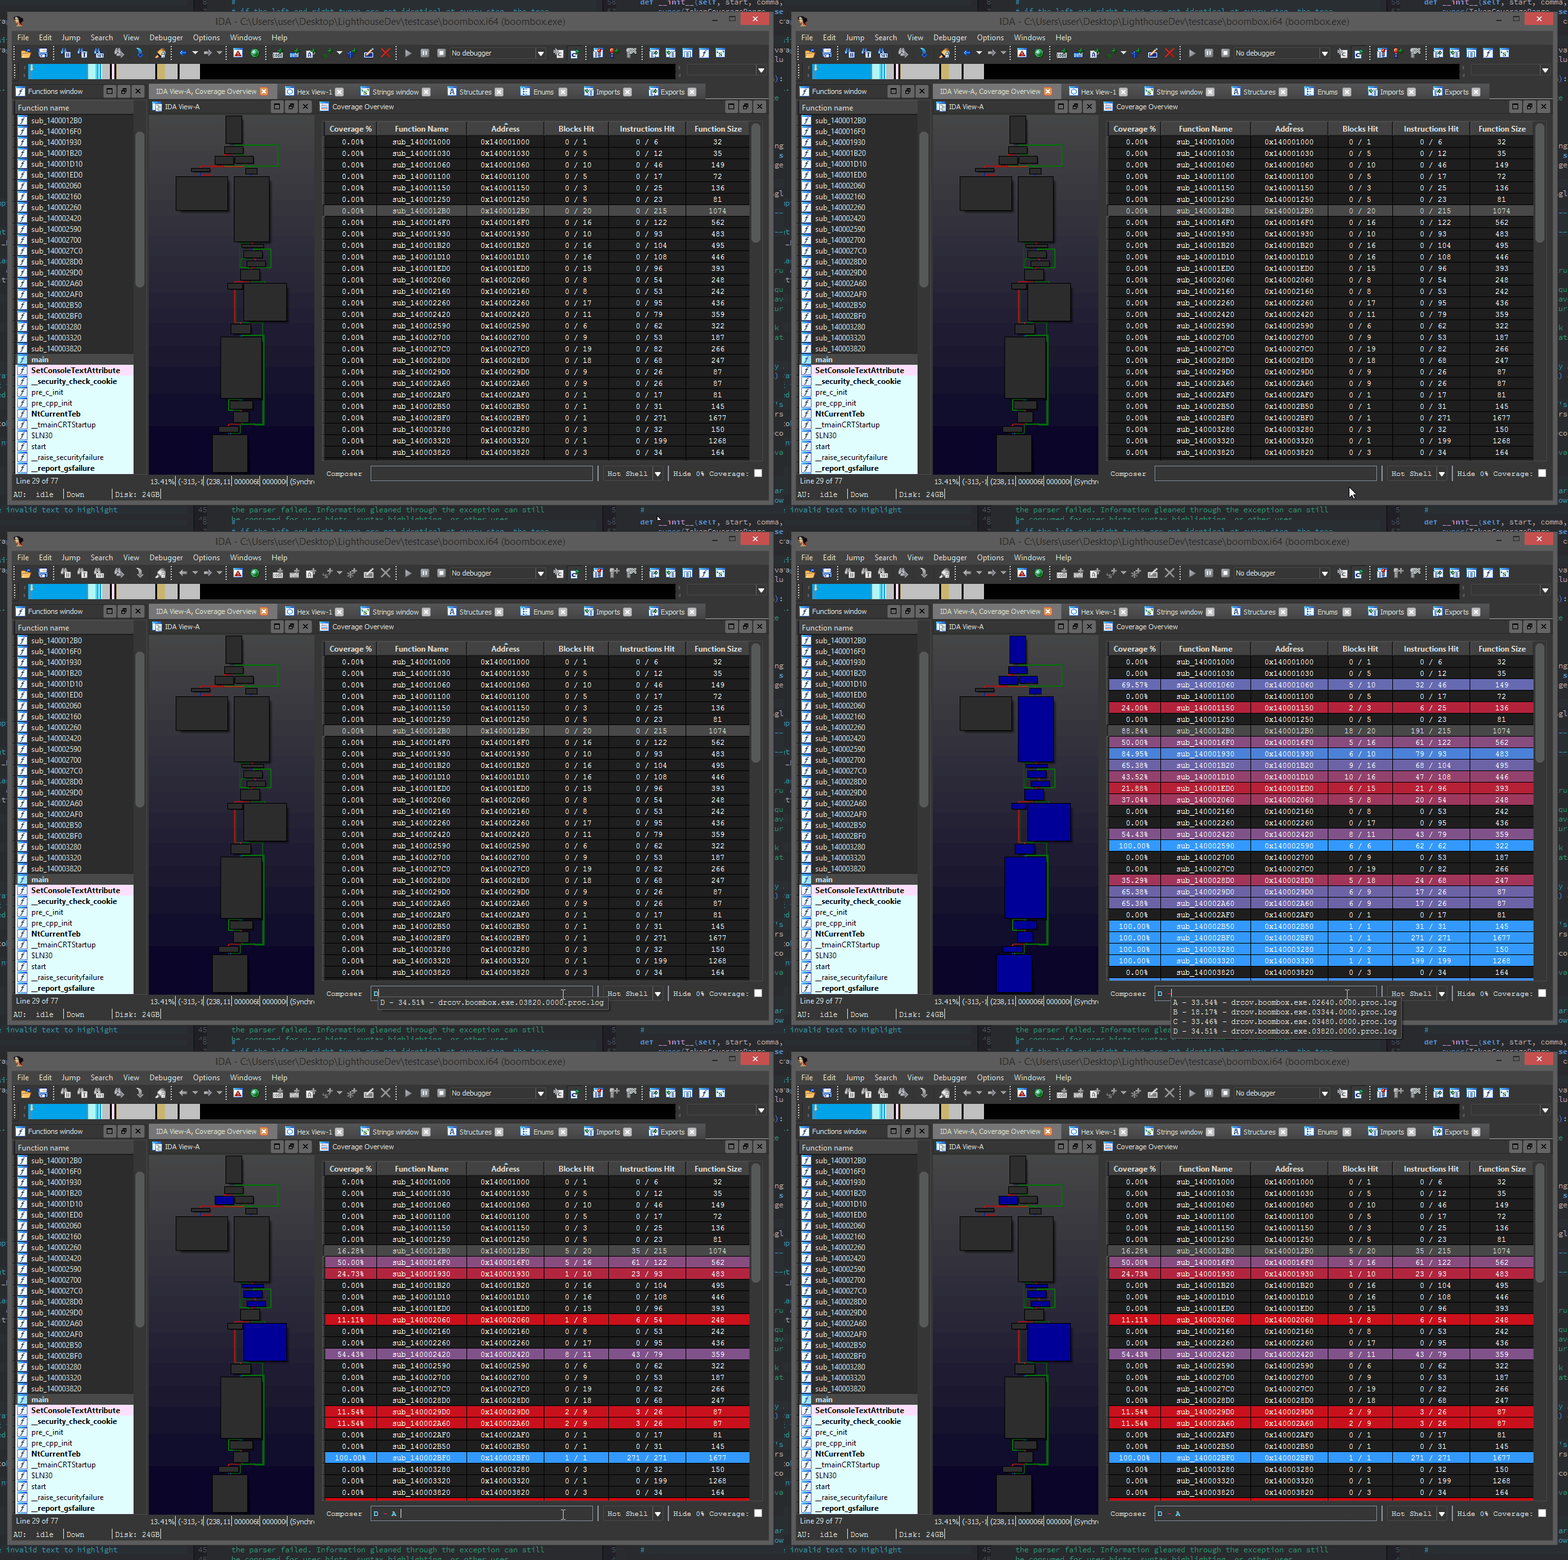
Building relationships between multiple sets of coverage data often distills deeper meaning than their individual parts. The shell at the bottom of the Coverage Overview provides an interactive means of constructing these relationships.
Pressing enter on the shell will evaluate and save a user constructed composition.
Coverage composition, or Composing as demonstrated above is achieved through a simple expression grammar and 'shorthand' coverage symbols (A to Z) on the composing shell.
- Logical Operators:
|, &, ^, - - Coverage Symbol:
A, B, C, ..., Z - Coverage Range:
A,C,Q,Z, ... - Parenthesis:
(...)
A & B(A & B) | C(C & (A - B)) | (F,H & Q)
The evaluation of the composition may occur right to left, parenthesis are suggested for potentially ambiguous expressions.
Additionally, there is a 'Hot Shell' mode that asynchronously evaluates and caches user compositions in real-time.
The hot shell serves as a natural gateway into the unguided exploration of composed relationships.
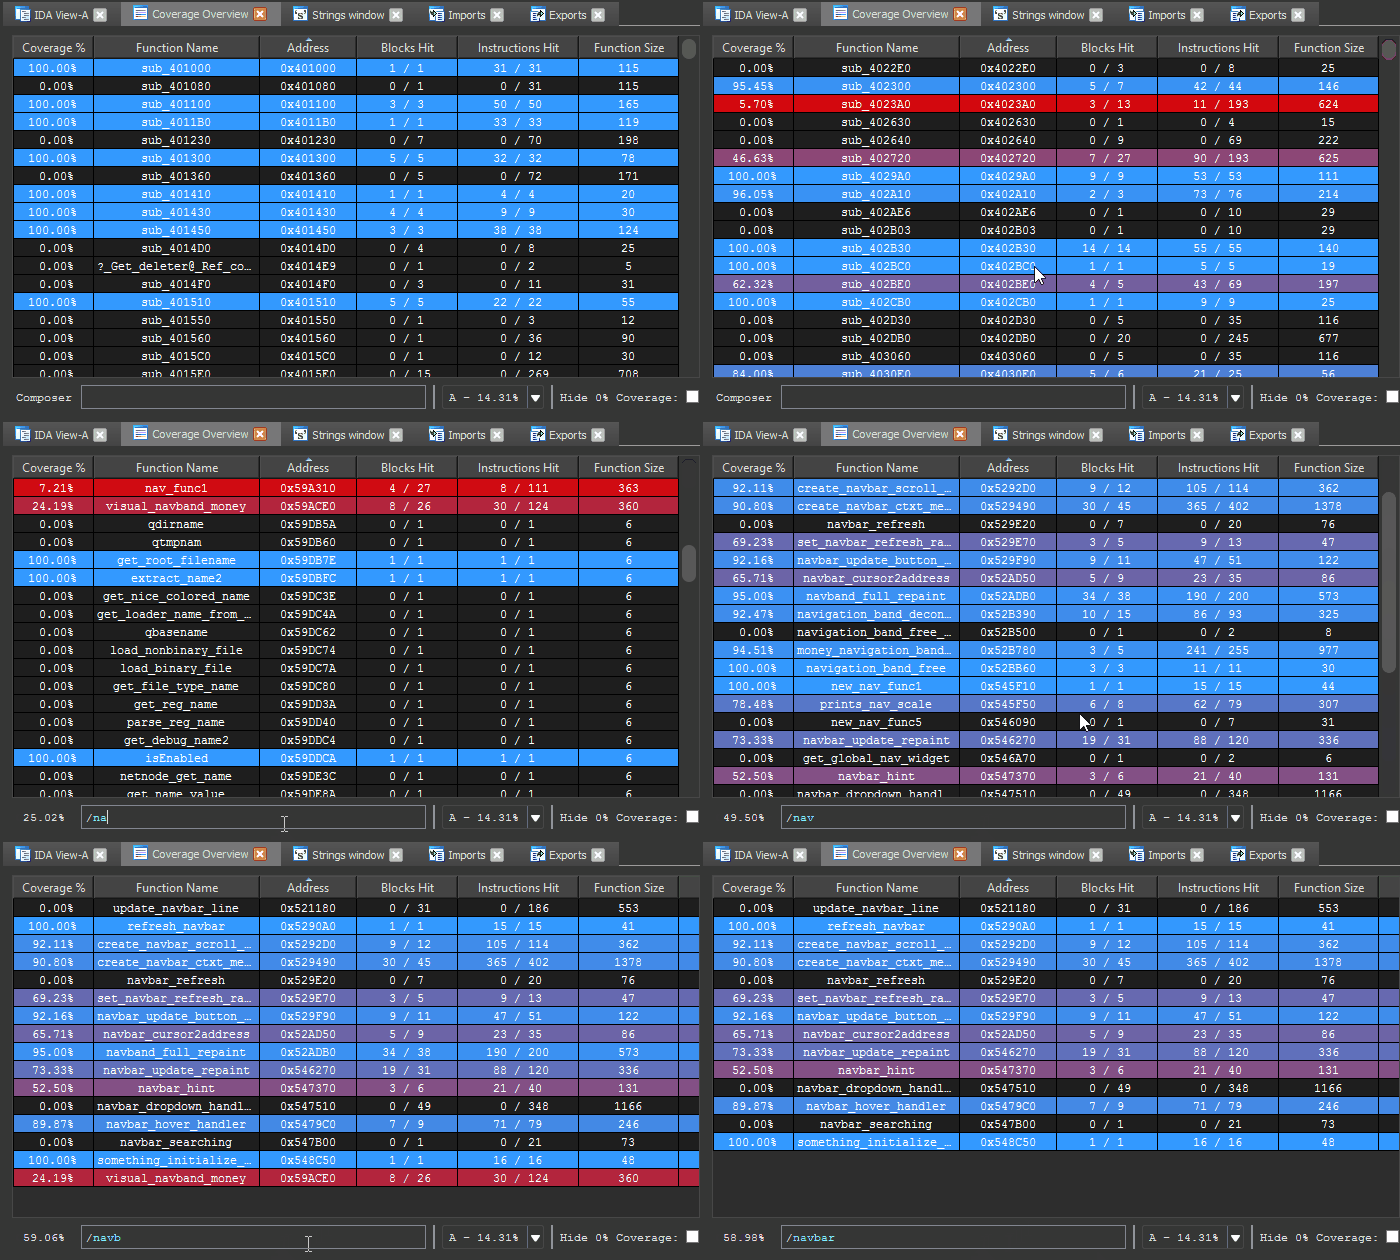
Using the shell, one can search and filter the functions listed in the coverage table by prefixing their query with /.
The head of the shell will show an updated coverage % computed only from the remaining functions. This is useful when analyzing coverage for specific function families.
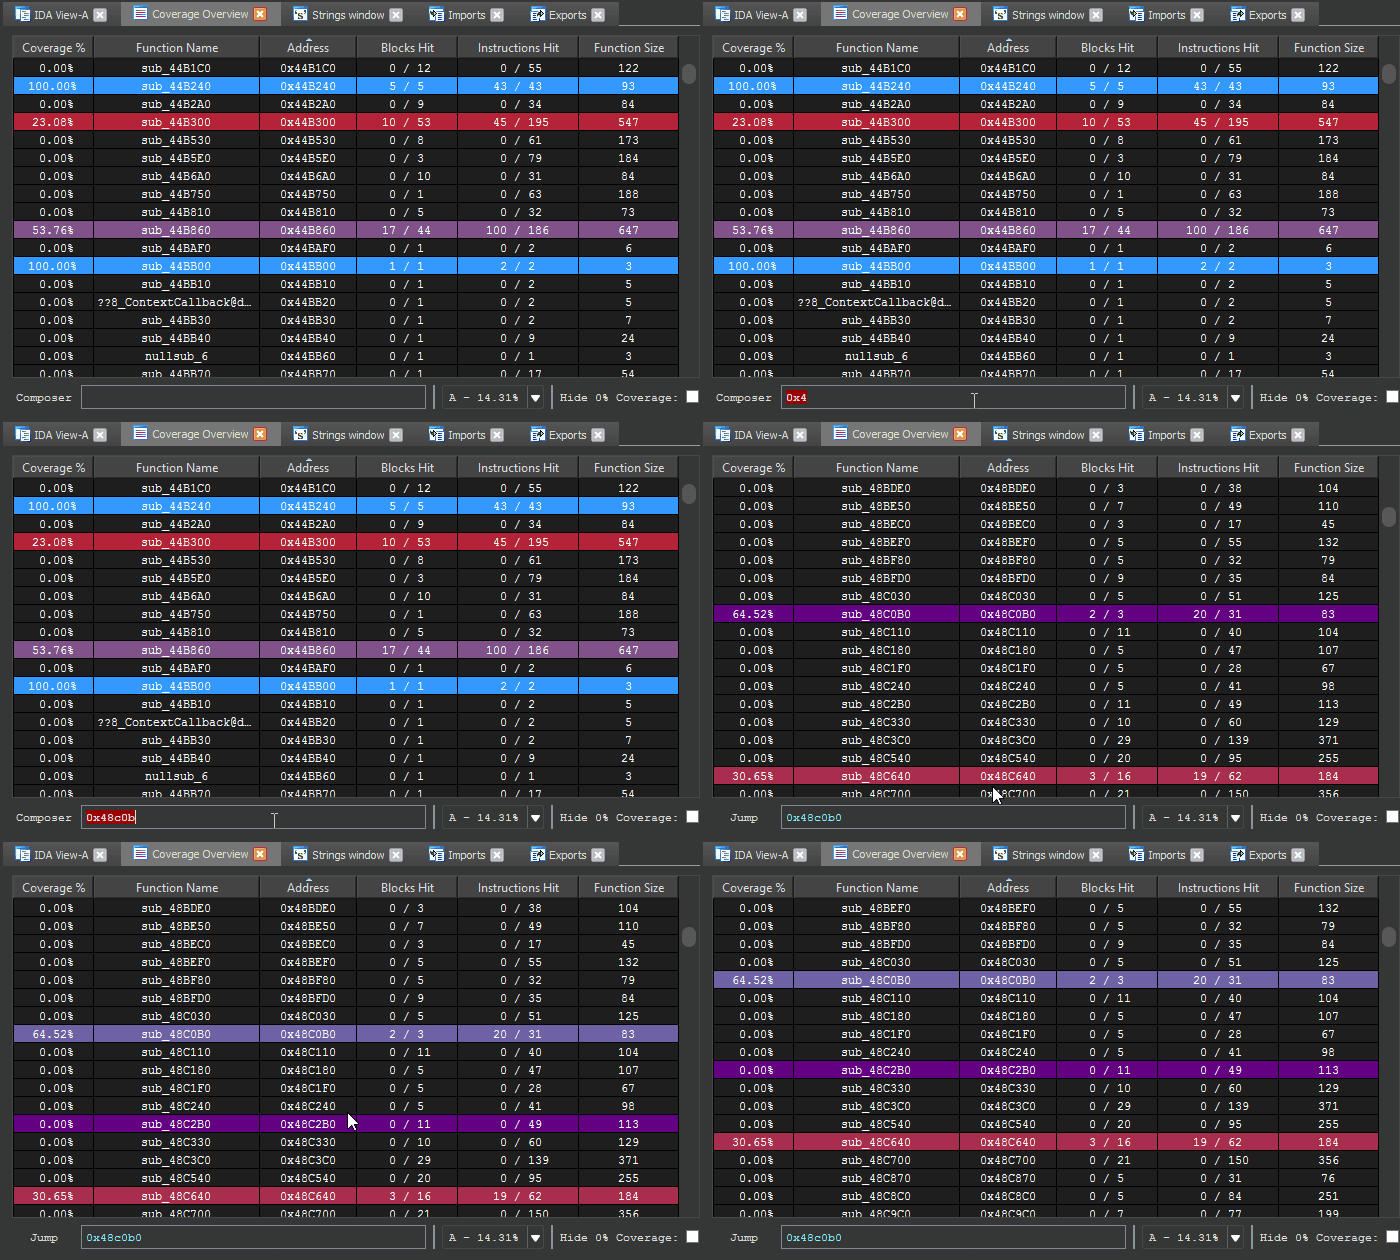
Entering an address or function name into the shell can be used to jump to corresponding function entries in the table.
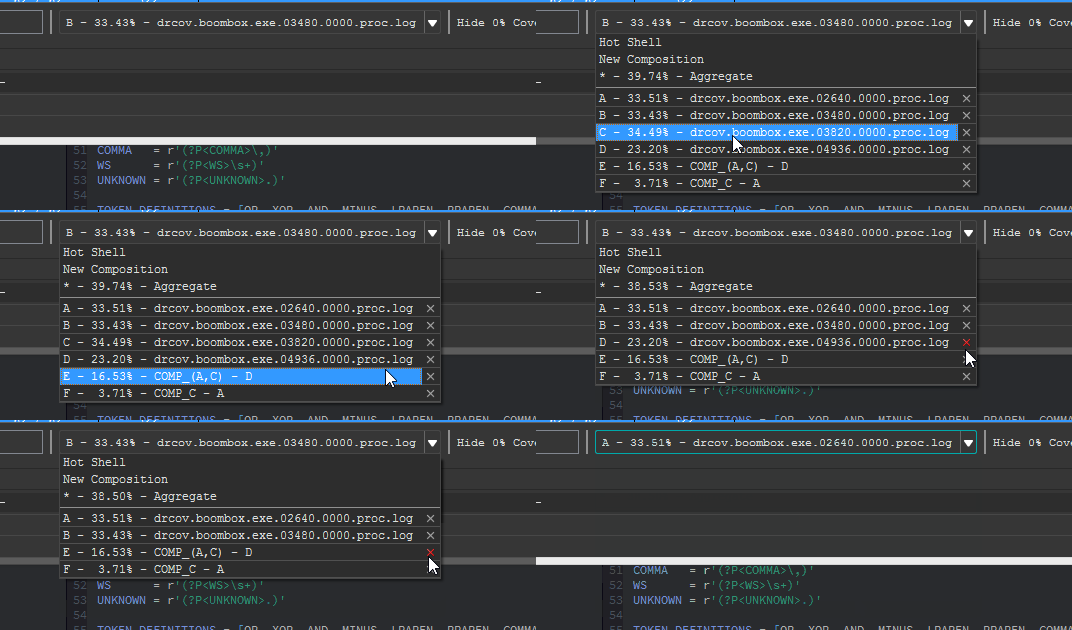
Loaded coverage data and user constructed compositions can be selected or deleted through the coverage combobox.
Before using Lighthouse, one will need to collect code coverage data for their target binary / application.
The examples below demonstrate how one can use DynamoRIO, Intel Pin or Frida to collect Lighthouse compatible coverage against a target. The .log files produced by these instrumentation tools can be loaded directly into Lighthouse.
Code coverage data can be collected via DynamoRIO's drcov code coverage module.
Example usage:
..\DynamoRIO-Windows-7.0.0-RC1\bin64\drrun.exe -t drcov -- boombox.exe
Using a custom pintool contributed by Agustin Gianni, the Intel Pin DBI can also be used to collect coverage data.
Example usage:
pin.exe -t CodeCoverage64.dll -- boombox.exe
For convenience, binaries for the Windows pintool can be found on the releases page. MacOS and Linux users need to compile the pintool themselves following the instructions included with the pintool for their respective platforms.
Lighthouse offers limited support for Frida based code coverage via a custom instrumentation script contributed by yrp.
Example usage:
sudo python frida-drcov.py bb-bench
Time and motivation permitting, future work may include:
Asynchronous composition, painting, metadata collectionMultifile/coverage support- Profiling based heatmaps/painting
- Coverage & Profiling Treemaps
Additional coverage sources, trace formats, etc- Improved Pseudocode painting
I welcome external contributions, issues, and feature requests.
- Markus Gaasedelen (@gaasedelen)
