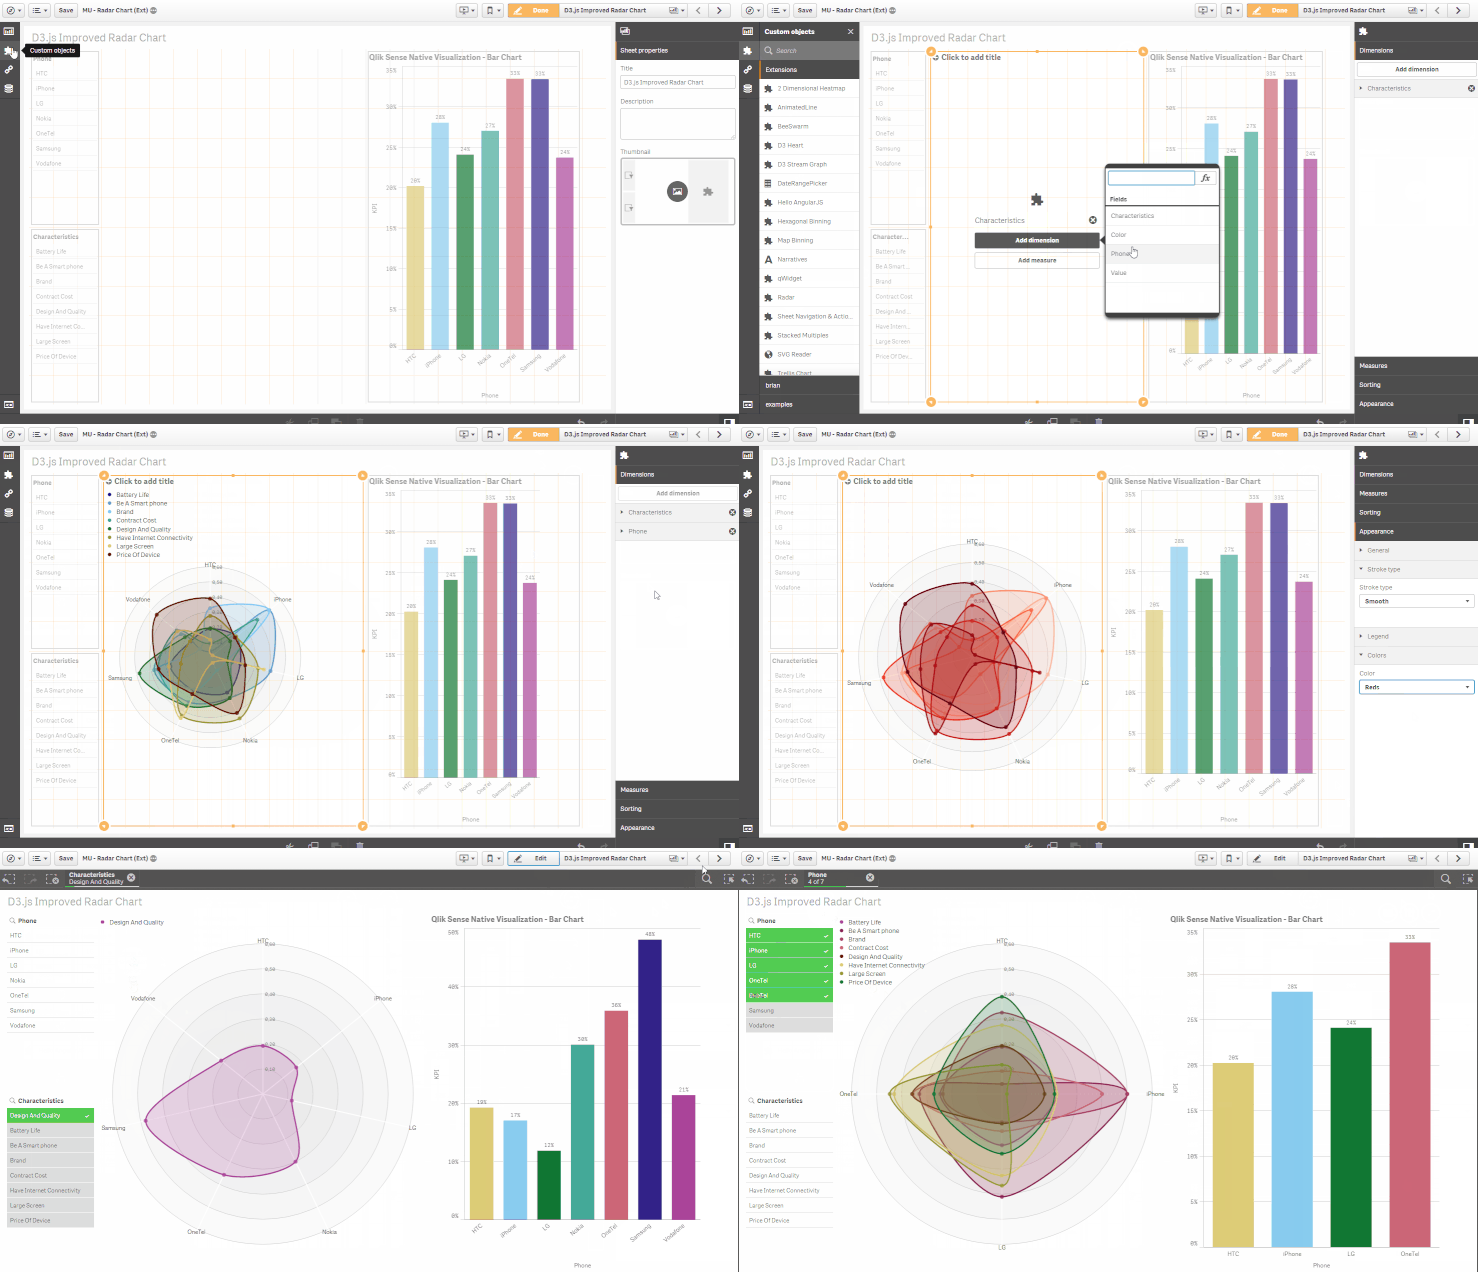
Developed by Brian Booden & Matthieu Burel, based on D3.js
- Added support for 10k points, previously was limited to 50
- Simplified Dimensions by adding 2 mandatory, instead of 1 mandatory and 1 optional, which was confusing
- Reworked, simpler color schemes
- Tweaks to label sizes, radar positioning and margins, and legend spacing, to make best use of space
Please try the new version, and leave feedback, as we endeavour to improve our extension!
Regards, Brian and Matt
=================
Qlik Sense extension displaying multivariate data in the form of a two-dimensional chart of three or more quantitative variables represented on axes starting from the same point: http://en.wikipedia.org/wiki/Radar_chart
The extension is based on and/or inspired by :
Distributed using MIT License
Permission is hereby granted, free of charge, to any person obtaining a copy of this software and associated documentation files (the "Software"), to deal in the Software without restriction, including without limitation the rights to use, copy, modify, merge, publish, distribute, sublicense, and/or sell copies of the Software, and to permit persons to whom the Software is furnished to do so, subject to the following conditions:
The above copyright notice and this permission notice shall be included in all copies or substantial portions of the Software.
THE SOFTWARE IS PROVIDED "AS IS", WITHOUT WARRANTY OF ANY KIND, EXPRESS OR IMPLIED, INCLUDING BUT NOT LIMITED TO THE WARRANTIES OF MERCHANTABILITY, FITNESS FOR A PARTICULAR PURPOSE AND NONINFRINGEMENT. IN NO EVENT SHALL THE AUTHORS OR COPYRIGHT HOLDERS BE LIABLE FOR ANY CLAIM, DAMAGES OR OTHER LIABILITY, WHETHER IN AN ACTION OF CONTRACT, TORT OR OTHERWISE, ARISING FROM, OUT OF OR IN CONNECTION WITH THE SOFTWARE OR THE USE OR OTHER DEALINGS IN THE SOFTWARE.
