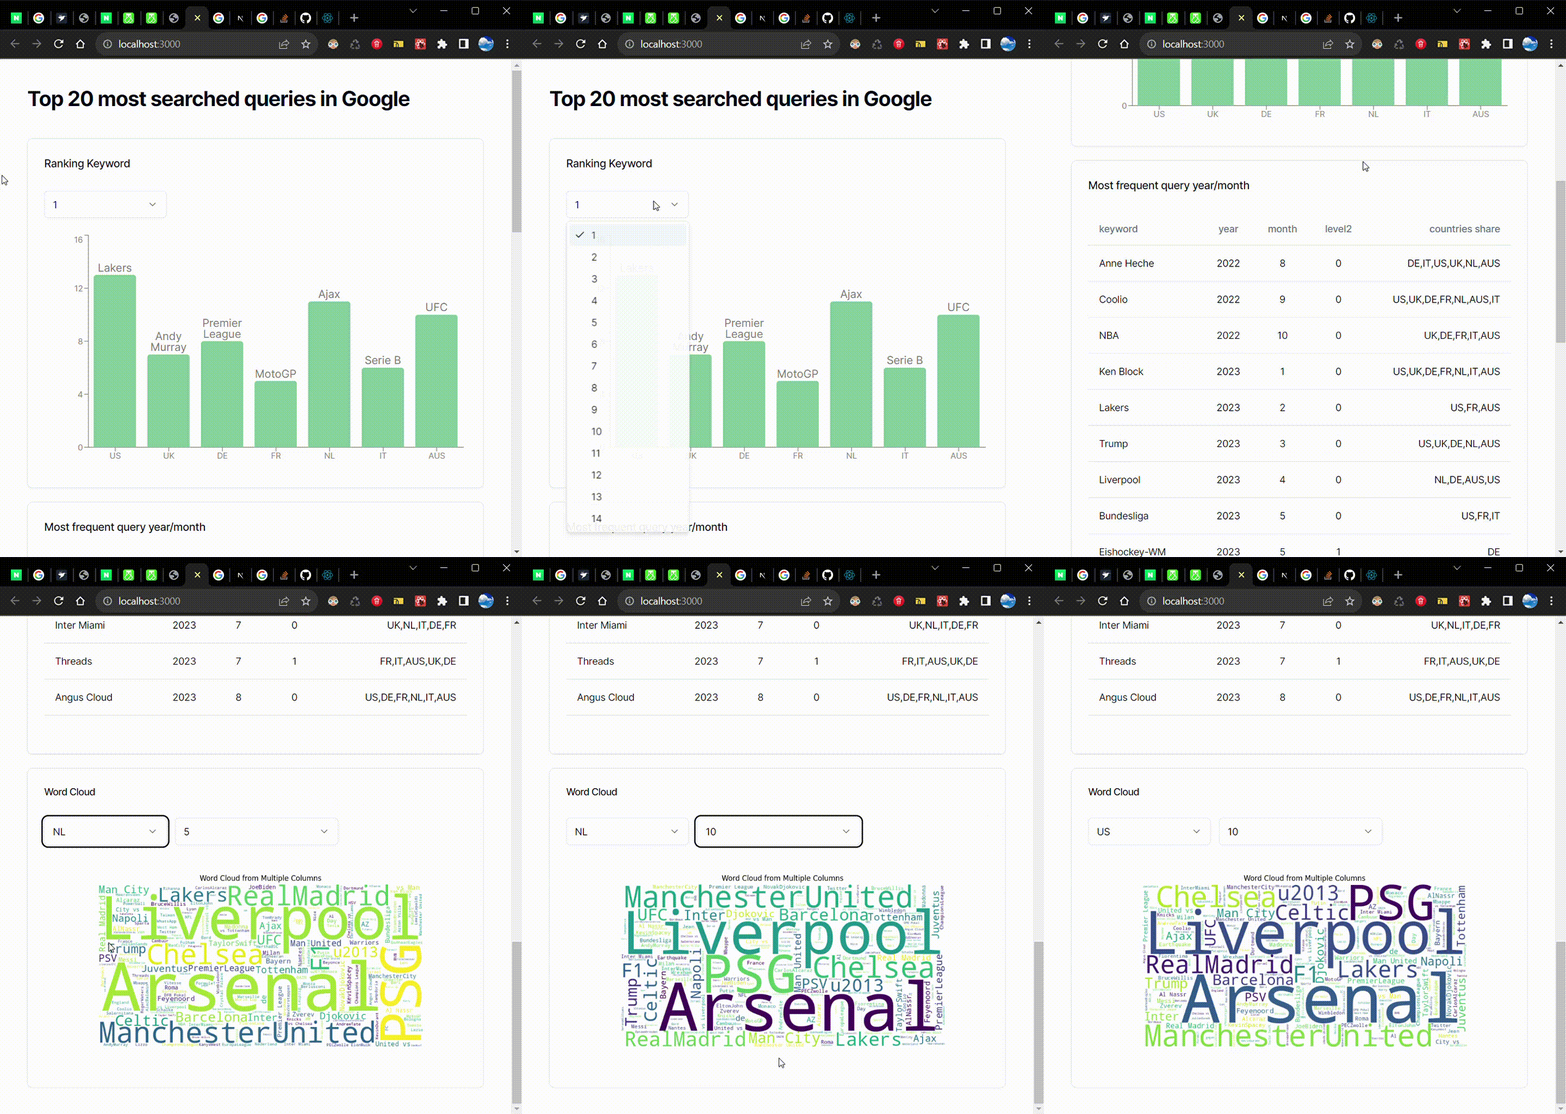
- FastAPI 기반 EDA 시각화 서버
- 구동 방법
git clone https://github.com/wschung1113/b2-webproject.git
cd b2-webproject
cd backend
python -m venv .venv
pip install -r requirements.txt
uvicorn app:app --reload --port 8000- 백엔드 API 서버가 먼저 실행되어 있어야 합니다.
- 실행 방법
git clone https://github.com/wschung1113/b2-webproject.git
cd b2-webproject
cd frontend
npm install
npm run dev
- 출처: https://www.kaggle.com/datasets/lorentzyeung/top-20-most-searched-queries-in-google-search
- 연/월별로 US, UK, Germany, France, Netherlands, Italy, Australia에서 가장 많이 검색된 Top 20 쿼리 데이터셋
- 팀 내부적으로 22년 8월부터 23년 8월까지 총 1년간의 데이터를 사용하기로 결정
- 각 .csv 파일을 순회하며 단일 DataFrame으로 취합
  # Specify the directory containing CSV files
  directory_path = Path('data')

  # Initialize an empty list to store DataFrames
  dfs = []

  # Loop through CSV files in the directory
  for csv_file in directory_path.glob('*.csv'):
      df = pd.read_csv(csv_file, encoding='latin1')
      dfs.append(df)

  # Concatenate all DataFrames into one
  df = pd.concat(dfs, ignore_index=True)

  # take out first two meaningless columns
df = df.iloc[:, 2:]-
df.head()
    @app.get("/head/", response_class=HTMLResponse)
    async def get_head(n_rows: int=None):
        if n_rows is None:
            n_rows = 5
        df_head = df.head(n_rows)

        # Convert the DataFrame to HTML
        df_html = df_head.to_html(classes='table table-striped table-hover')

        # Create an HTML template with the DataFrame embedded
        html_content = f"""
        <html>
        <head>
            <title>DataFrame Display</title>
        </head>
        <body>
            <h1>DataFrame Display</h1>
            {df_html}
        </body>
        </html>
        """

        return HTMLResponse(content=html_content)
-
df.describe()
@app.get("/describe")
async def get_describe():
    df_desc = df.describe(include='object')

    # Convert the DataFrame to HTML
    df_html = df_desc.to_html(classes='table table-striped table-hover')

    # Create an HTML template with the DataFrame embedded
    html_content = f"""
    <html>
    <head>
        <title>DataFrame Display</title>
    </head>
    <body>
        <h1>DataFrame Display</h1>
        {df_html}
    </body>
    </html>
    """

    return HTMLResponse(content=html_content)
-
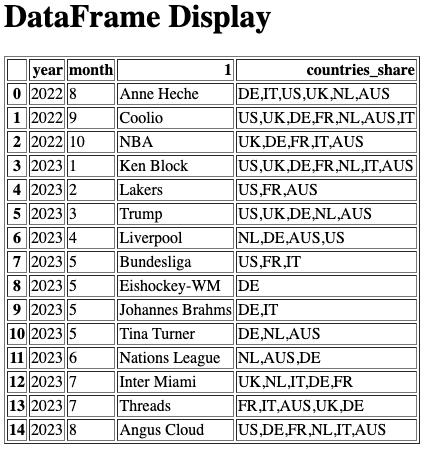
각 연월별 가장 많이 검색된 쿼리와 해당 쿼리가 가장 많이 검색된 국가
@app.get("/mode/")
async def get_mode():
    # most frequent query by year and month
    most_frequent = df.groupby(['year', 'month'])['1'].apply(lambda x: x.mode())

    # Create a new DataFrame to present the results
    result_df = most_frequent.reset_index()

    countries_share = []
    for i in range(len(result_df)):
        year = result_df.loc[i, 'year']
        month = result_df.loc[i,'month']
        top_query = result_df.loc[i, '1']
        countries_share.append(','.join(df[(df['year']==year) & (df['month']==month) & (df['1']==top_query)].kw_location.unique()))
    result_df.loc[:, 'countries_share'] = countries_share

    # Convert the DataFrame to HTML
    df_html = result_df.iloc[:, [0, 1, 3, 4]].to_html(classes='table table-striped table-hover')

    # Create an HTML template with the DataFrame embedded
    html_content = f"""
    <html>
    <head>
        <title>DataFrame Display</title>
    </head>
    <body>
        <h1>DataFrame Display</h1>
        {df_html}
    </body>
    </html>
    """

    return HTMLResponse(content=html_content)
-
Top N Word Cloud
@app.get("/word-cloud/", response_class=HTMLResponse)
async def plot_wc(country: str=None, n_ranks: int=None):

    # word cloud
    if country is None:
        df_country = df.copy()
    else:
        df_country = df[df['kw_location'] == country]
    columns = df_country['1']
    for i in range(n_ranks):
        df_country.iloc[:, 6+i] = df_country.iloc[:, 6+i].apply(lambda x: x.replace(' ', ''))
        if i != 0:
            columns += ' ' + df_country.iloc[:, 6+i]

    # Concatenate text from multiple columns into a single string
    combined_text = ' '.join(columns)

    # Create a WordCloud object
    wordcloud = WordCloud(width=800, height=400, background_color='white').generate(combined_text)

    # Display the word cloud plot
    plt.figure(figsize=(10, 5))
    plt.imshow(wordcloud, interpolation='bilinear')
    plt.axis('off')
    plt.title('Word Cloud from Multiple Columns')
    # plt.show()

    # Save the plot as an image in memory
    buffer = BytesIO()
    plt.savefig(buffer, format="png")
    buffer.seek(0)

    # Encode the image data as base64
    image_base64 = base64.b64encode(buffer.read()).decode("utf-8")

    # Return an HTML page with the image
    html_content = f"""
    <html>
    <head>
        <title>Matplotlib Plot on Web Page</title>
    </head>
    <body>
        <h1>Matplotlib Plot</h1>
        <img src="data:image/png;base64,{image_base64}" alt="Sample Plot">
    </body>
    </html>
    """

    return HTMLResponse(content=html_content)
- 국가 미지정 시 모든 국가 대상으로 word cloud 생성
- 가능 입력 국가: US, UK, DE, FR, NL, AUS, IT
- n_ranks의 경우 Top n_ranks 쿼리들로 이루어진 word cloud 생성 (1 이상 입력)
- http://localhost:8080/word-cloud?country=US&n_ranks=5
- localhost:8000/word-cloud?country=US&n_ranks=5

-
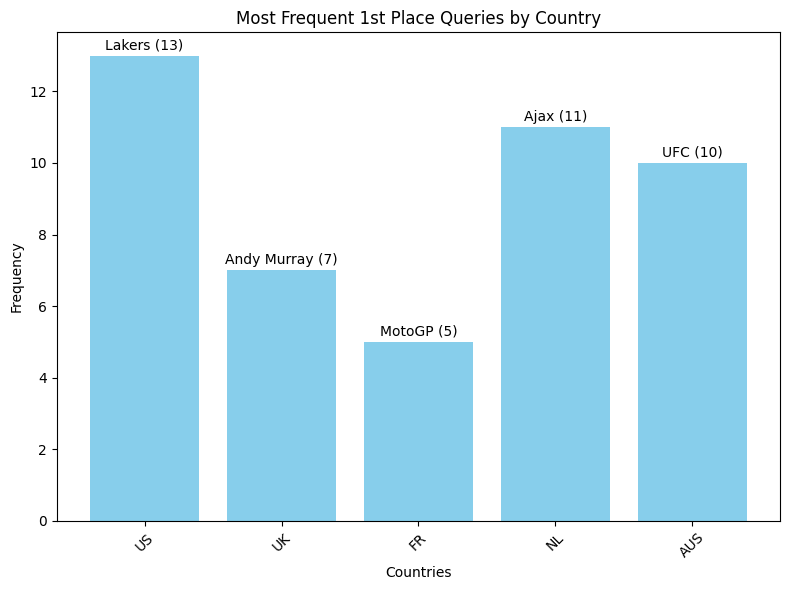
국가별 검색 순위 1위를 가장 많이 한 검색어
# Extract countries and queries
countries = list(firsts.keys())
queries = [entry[0] for entry in firsts.values()]
counts = [entry[1] for entry in firsts.values()]

# Create a bar plot
plt.figure(figsize=(8, 6))
plt.bar(countries, counts, color='skyblue')
plt.xlabel('Countries')
plt.ylabel('Frequency')
plt.title('Most Frequent 1st Place Queries by Country')
plt.xticks(rotation=45)

# Annotate the queries on the plot
for i, count in enumerate(counts):
    plt.text(countries[i], count + 0.1, f'{queries[i]} ({count})', ha='center', va='bottom')

plt.tight_layout()
plt.show()
- 국가별 월별 일간 1등을 가장 많이 한 검색어
merged_df = pd.concat([us_top1, uk_top1, fr_top1, nl_top1, aus_top1], axis=1)
merged_df.set_index('year_month', inplace=True)
merged_df.index = ['2022-08','2022-09','2022-10','2023-01','2023-02','2023-03','2023-04','2023-05','2023-06','2023-07','2023-08']
merged_df.columns = ['US', 'UK', 'FR', 'NL', 'AUS']
merged_df.T
-
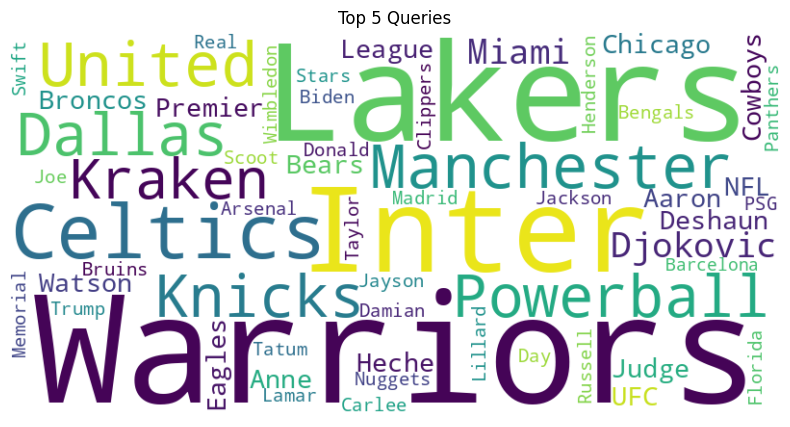
한 국가에서 월별 top 10에 가장 많이 올라온 검색어 5개 (미국)
from wordcloud import WordCloud

top_keywords = [keyword for queries in top_5_queries.values() for keyword in queries]

wordcloud = WordCloud(width=800, height=400, background_color='white').generate(' '.join(top_keywords))

plt.figure(figsize=(10, 5))
plt.imshow(wordcloud, interpolation='bilinear')
plt.axis('off')
plt.title('Top 5 Queries')
plt.show()


