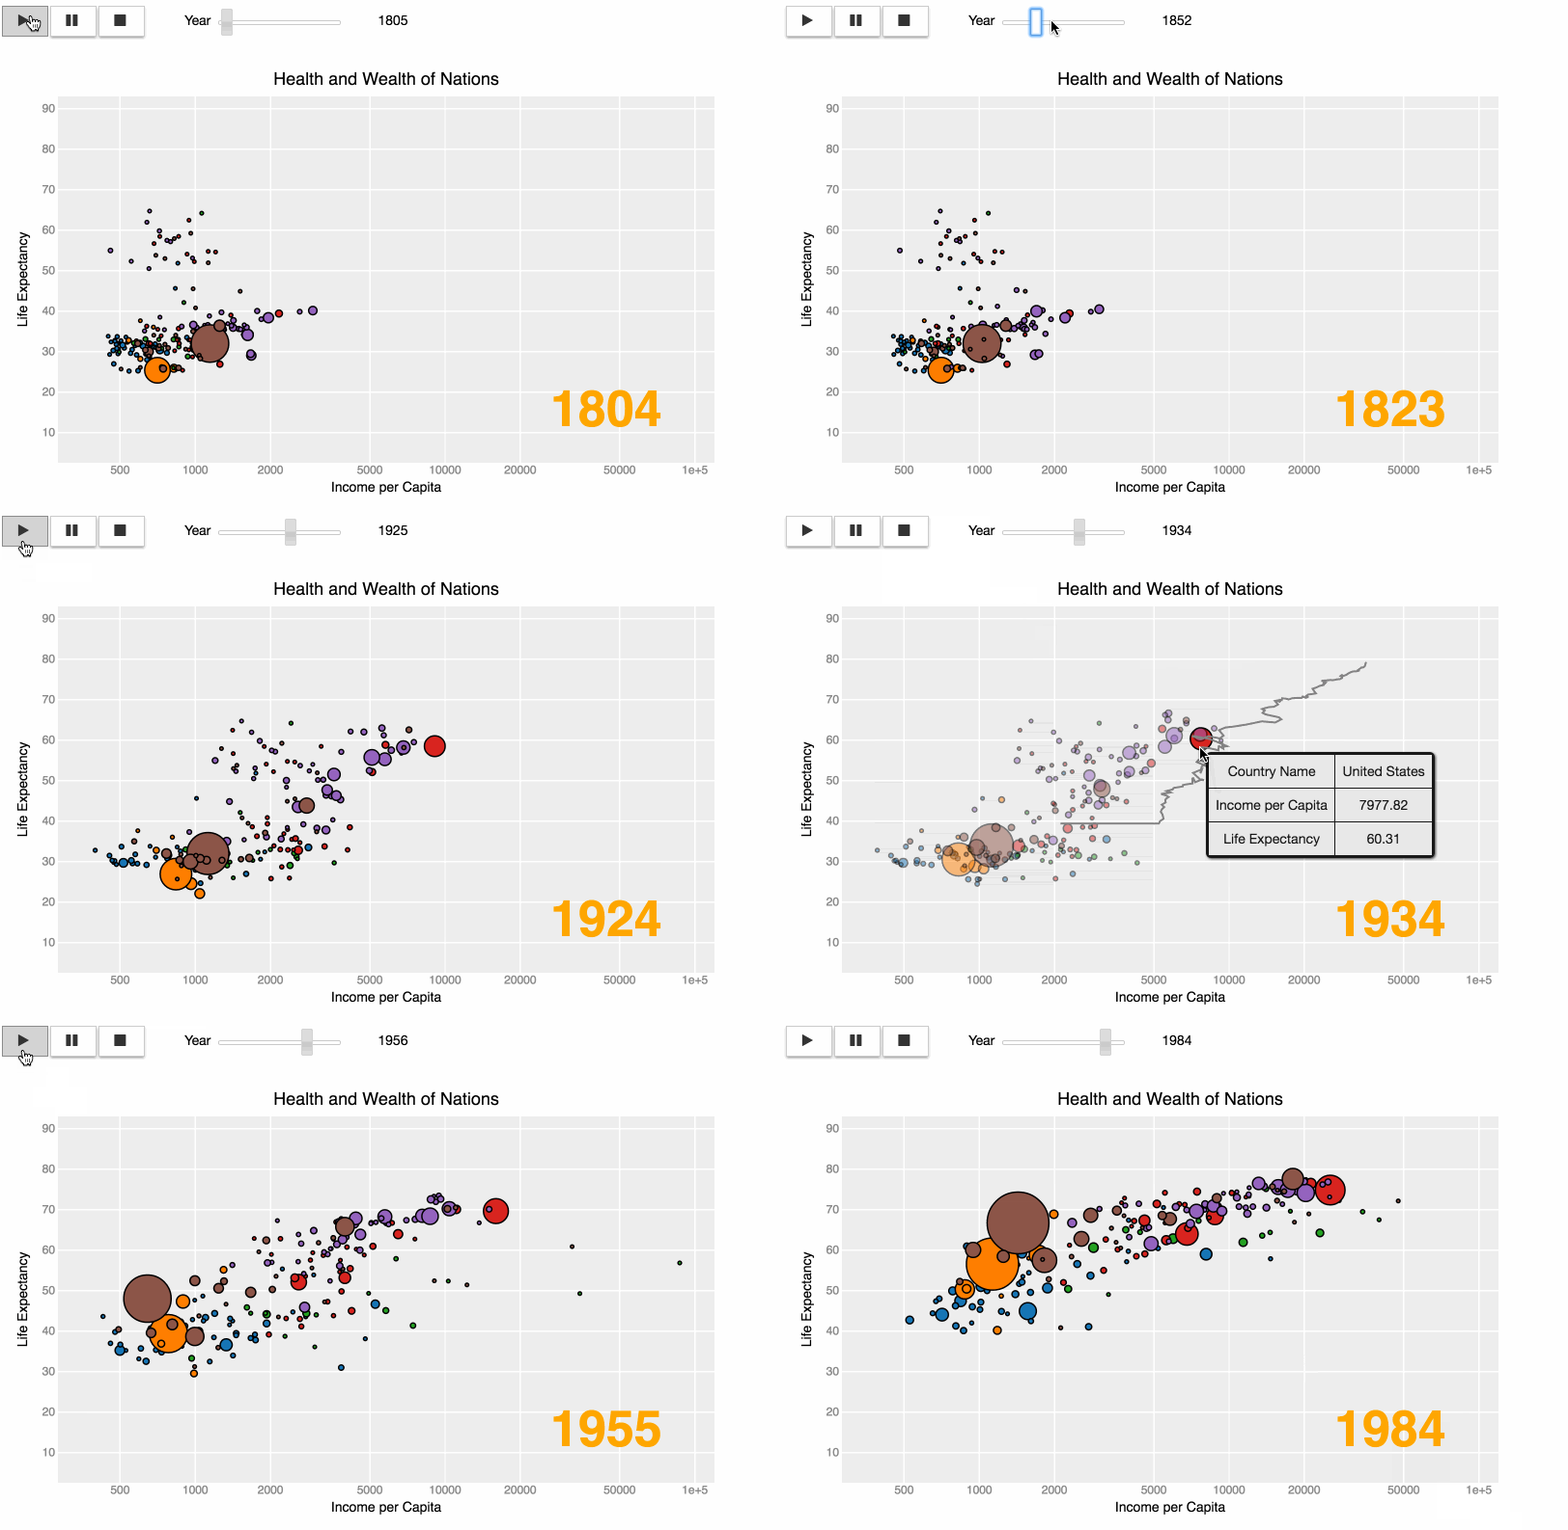
bqplot is a Grammar of Graphics-based interactive plotting framework for the Jupyter notebook.
In bqplot, every single attribute of the plot is an interactive widget. This allows the user to integrate any plot with IPython widgets to create a complex and feature rich GUI from just a few simple lines of Python code.
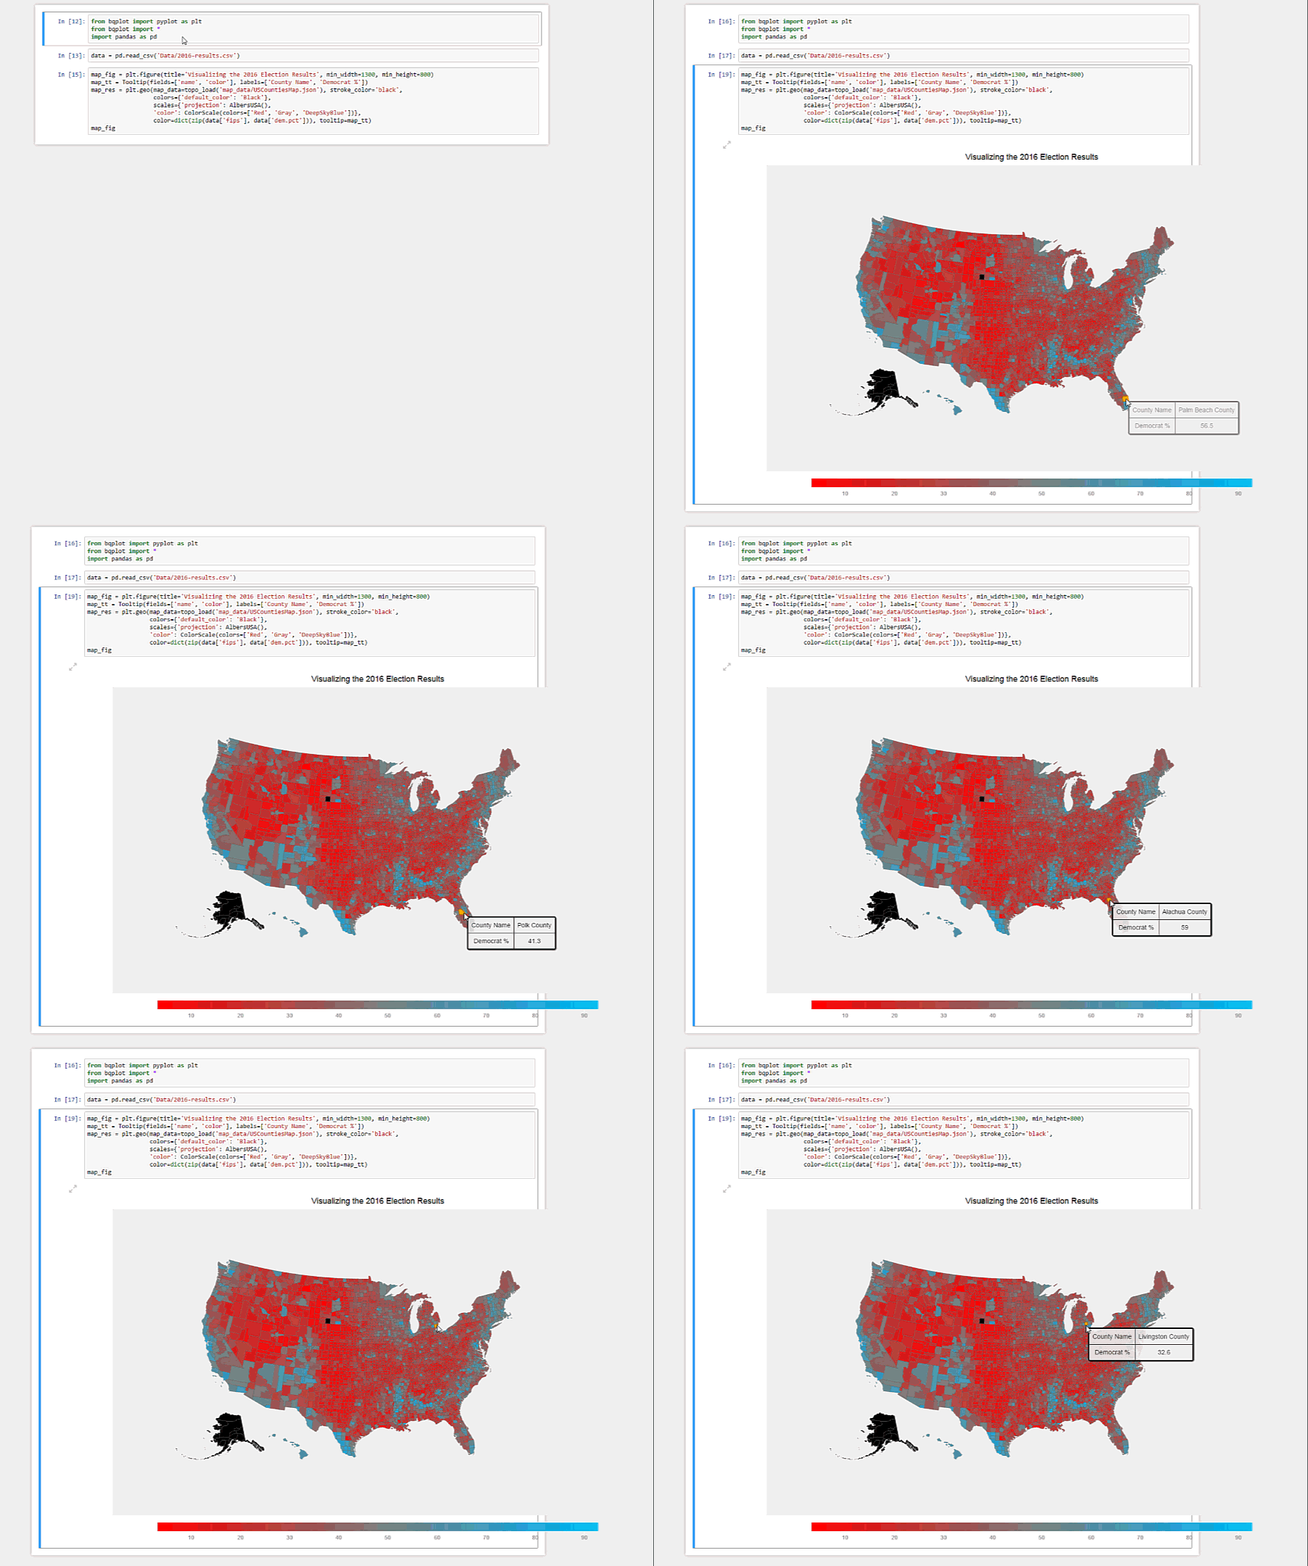
For example, just a few lines of code allow us to generate an interactive map that visualizes the 2016 US Presidential County Level Results:
- provide a unified framework for 2-D visualizations with a pythonic API.
- provide a sensible API for adding user interactions (panning, zooming, selection, etc)
Two APIs are provided
- Users can build custom visualizations using the internal object model, which is inspired by the constructs of the Grammar of Graphics (figure, marks, axes, scales), and enrich their visualization with our Interaction Layer.
- Or they can use the context-based API similar to Matplotlib's pyplot, which provides sensible default choices for most parameters.
Try it online with Binder
This package depends on the following packages:
ipywidgets(version >= 7.0.0)traitlets(version >= 4.3.0)traittypesnumpypandas
Using pip:
$ pip install bqplot
$ jupyter nbextension enable --py --sys-prefix bqplot
Using conda
$ conda install -c conda-forge bqplot
For a development installation (requires npm (version >= 3.8) and node (version >= 4.0)):
$ git clone https://github.com/bloomberg/bqplot.git
$ cd bqplot
$ pip install -e .
$ jupyter nbextension install --py --symlink --sys-prefix bqplot
$ jupyter nbextension enable --py --sys-prefix bqplot
Note for developers: the --symlink argument on Linux or OS X allows one to
modify the JavaScript code in-place. This feature is not available
with Windows.
For the experimental JupyterLab extension, install the Python package, make sure the Jupyter widgets extension is installed, and install the bqplot extension:
$ pip install bqplot
$ jupyter labextension install @jupyter-widgets/jupyterlab-manager # install the Jupyter widgets extension
$ jupyter labextension install bqplot
# In a Jupyter notebook
import bqplot
That's it! You're ready to go!
from bqplot import pyplot as plt
import numpy as np

plt.figure(1, title='Line Chart')
np.random.seed(0)
n = 200
x = np.linspace(0.0, 10.0, n)
y = np.cumsum(np.random.randn(n))
plt.plot(x, y)
plt.show()import numpy as np
from IPython.display import display
from bqplot import (
OrdinalScale, LinearScale, Bars, Lines, Axis, Figure
)
size = 20
np.random.seed(0)
x_data = np.arange(size)
x_ord = OrdinalScale()
y_sc = LinearScale()
bar = Bars(x=x_data, y=np.random.randn(2, size), scales={'x': x_ord, 'y':
y_sc}, type='stacked')
line = Lines(x=x_data, y=np.random.randn(size), scales={'x': x_ord, 'y': y_sc},
stroke_width=3, colors=['red'], display_legend=True, labels=['Line chart'])
ax_x = Axis(scale=x_ord, grid_lines='solid', label='X')
ax_y = Axis(scale=y_sc, orientation='vertical', tick_format='0.2f',
grid_lines='solid', label='Y')
Figure(marks=[bar, line], axes=[ax_x, ax_y], title='API Example',
legend_location='bottom-right')-
Send us an email at bqplot@bloomberg.net
This software is licensed under the Apache 2.0 license. See the LICENSE file for details.


