Unity + Lua script is now most popular incremental update frameWork for mobile game in China,However, since there haven't been good tool to monitor the cpu and memory usage of lua vm, lots of developers have no idea to optimize their code,so there are many potential risks in lua codes.
this tool is designed to support an easy-to-use profiler for unity that help finding bottleneck and make your game more fast and stable.
use administrator mode to run the link.bat
If you find any bug or have any suggests join the QQ group:882425563 to contact us
Lua Profiler For Unity supports XLua、SLua、ToLua and also a remote profiler tool so it supports Windows、Android、IOS On-device Profiler.
- You must open two unity projects,one for game client ,one for editor server
- Open LuaProfiler folder
- Copy LuaProfilerClient folder to you game project content,if your C# Lua script is in Plugins folder,Copy LuaProfilerClient to Plugins.This Tool must make sure That code must in the same DLL which has C# lua codes.
- Use Unity5.6 or newer unity version to create a project, copy LuaProfilerServer to the project content
| Name | Descriptions |
|---|---|
Overview |
function name |
totalLuaMemory |
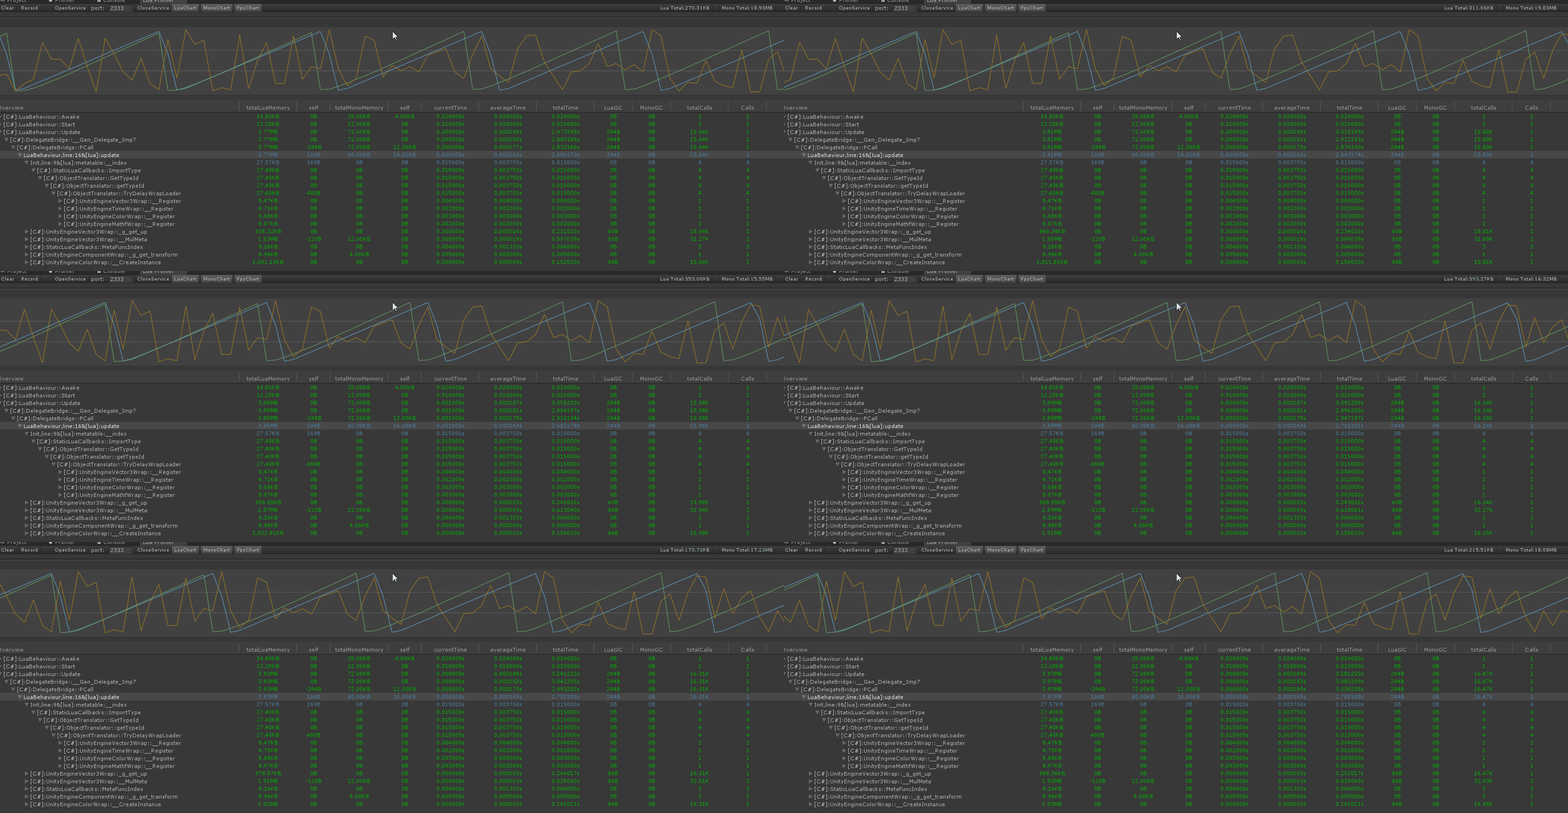
The sum of all Lua GCs produced by this function If GC happens then the value will not be very accurate |
self |
The amount of GC produced by the function itself,If the value is negative, the subfunction produces a GC |
totalMonoMemory |
The sum of all Mono GCs produced by this function If GC happens then the value will not be very accurate |
self |
The amount of GC produced by the function itself ,If the value is negative, the subfunction produces a GC |
currentTime |
The time it takes for the function to run in current frame |
averageTime |
Count the average value of the time spent on the function |
totalTime |
All the time consumed by this function |
LuaGC |
Lua GC generated by the current frame |
MonoGC |
Mono GC generated by the current frame |
totalCalls |
The number of runs of this function after the game starts |
Calls |
The number of executions of the current frame of the function |
It use mono.ceil's IL inject feature(also use in XLua),inject the profiler code to game code
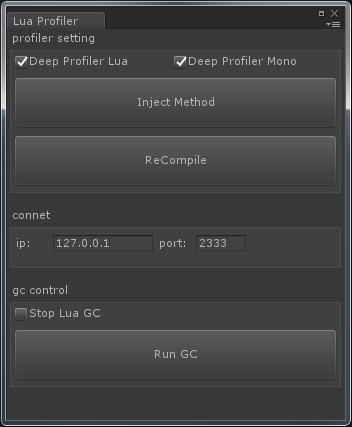
Open windows by "Window->Lua Profiler Window", toggle profiler's feature and configure the server ip address.
Select the kind of code you want profiler,C# code color is green,and lua code color is blue.
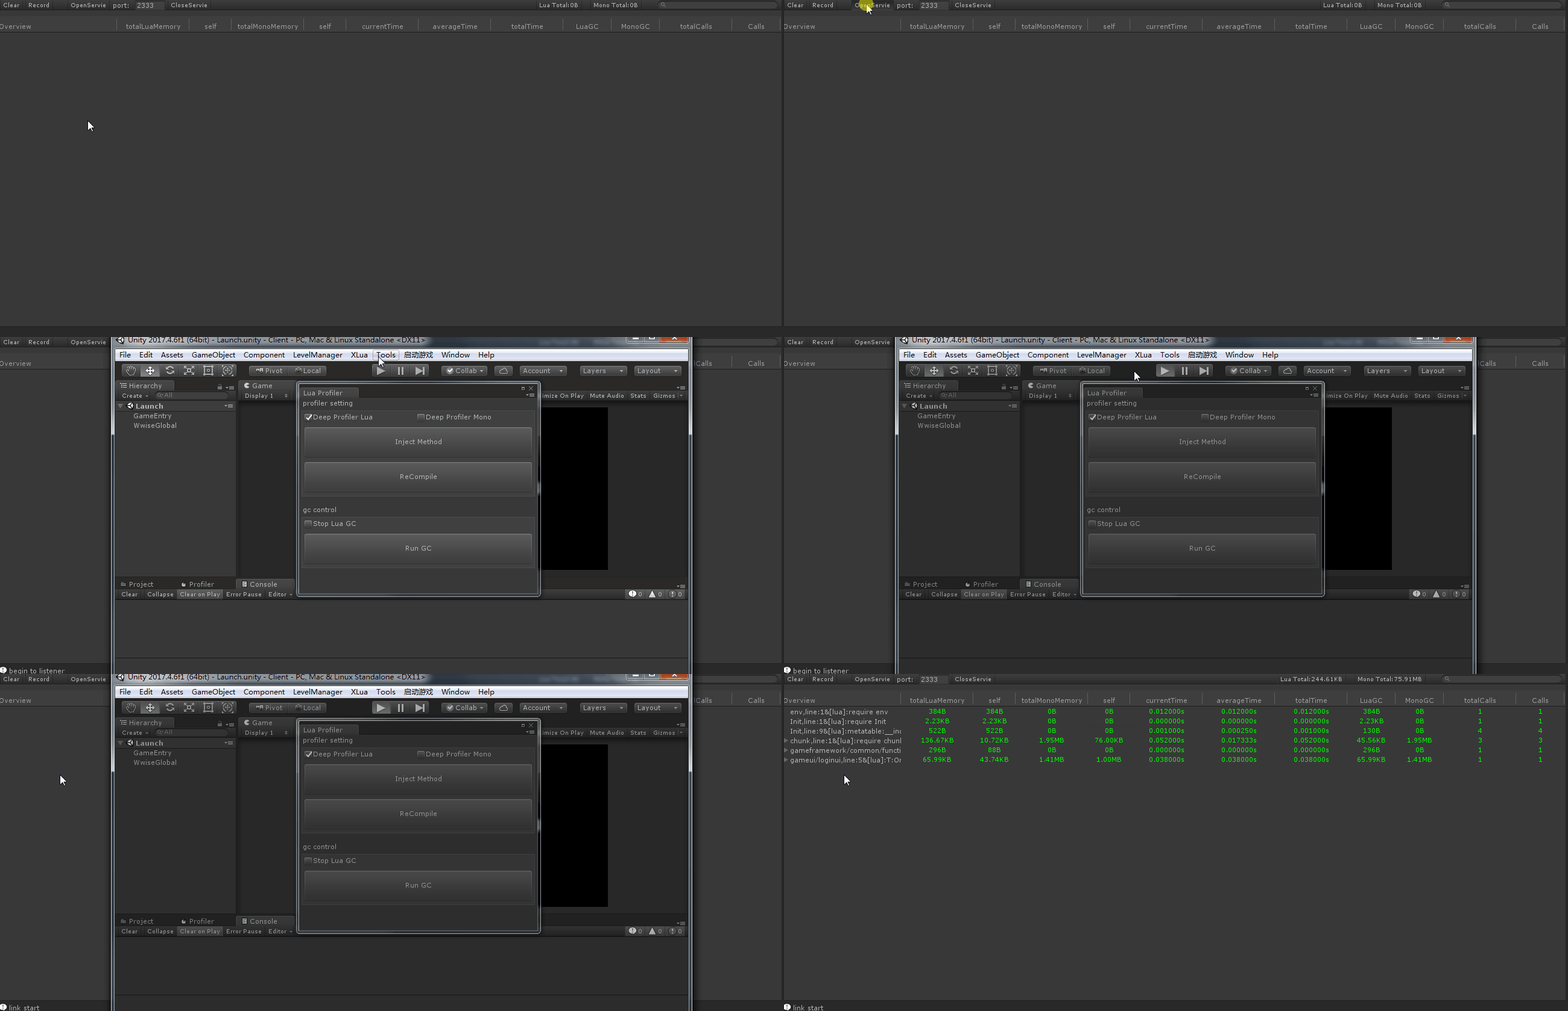
Also open windows by "Window->Lua Profiler Window", then click OpenService,wait for client connects
- Toggle
LuaChartto open lua memory chart,line color is blue. - Toggle
MonoChartto open mono memory chart,line color is green. - Toggle
FpsChartto open fps chart,line color is orange.
Click Record button, when game connect to server, toggle StartRecord to start or stop record.
- drag slider to modify samples
- click '<' 、 '>' to increase or discrease frames one by one
- click '<<' 、 '>>' to fast locate the frames control by Capture Lua GC、Capture Mono GC、Frame Count
- stop record and press left or right arrow keybord to increase or discrease frames one by one
Set macro USE_LUA_PROFILER to inject profiler code in you App.If you want to use luac code or luajit bytecode ,use InjectLua.exe in folder tools To inject the lua profiler code.
InjectLua.exe "inpath" "outpath"
easy66
Xavier
Jay
ZhangDi
and all members in qq group LuaProfiler


