- Introduction
- Project automation
- Running Locally via Docker Compose
- Deploying to Kubernetes
- Deploying to Azure Container Apps
This is a sample application demonstrating Quarkus features and best practices. The application allows superheroes to fight against supervillains. The application consists of several microservices, communicating either synchronously via REST or asynchronously using Kafka. All the data used by the applications are on the characterdata branch of this repository.
- Super Hero Battle UI
- An Angular application to pick up a random superhero, a random supervillain, and makes them fight.
- Villain REST API
- A classical HTTP microservice exposing CRUD operations on Villains, stored in a PostgreSQL database.
- Implemented with blocking endpoints using RESTEasy Reactive and Quarkus Hibernate ORM with Panache's active record pattern.
- Favors field injection of beans (
@Injectannotation) over construction injection. - Uses the Quarkus Qute templating engine for its UI.
- Hero REST API
- A reactive HTTP microservice exposing CRUD operations on Heroes, stored in a PostgreSQL database.
- Implemented with reactive endpoints using RESTEasy Reactive and Quarkus Hibernate Reactive with Panache's repository pattern.
- Favors constructor injection of beans over field injection (
@Injectannotation). - Uses the Quarkus Qute templating engine for its UI.
- Fight REST API
- A REST API invoking the Hero and Villain APIs to get a random superhero and supervillain. Each fight is then stored in a MongoDB database.
- Implemented with reactive endpoints using RESTEasy Reactive and Quarkus MongoDB Reactive with Panache's active record pattern.
- Invocations to the Hero and Villain APIs are done using the reactive rest client and are protected using resilience patterns, such as retry, timeout, and circuit breaking.
- Each fight is asynchronously sent, via Kafka, to the Statistics microservice.
- Messages on Kafka use Apache Avro schemas and are stored in an Apicurio Registry, all using built-in support from Quarkus.
- Statistics
- Calculates statistics about each fight and serves them to an HTML + JQuery UI using WebSockets.
- Prometheus
- Polls metrics from all the services within the system.
- OpenTelemetry Collector
- All services export distributed trace information to the collector.
- Jaeger
- The collector exports trace information into Jaeger.
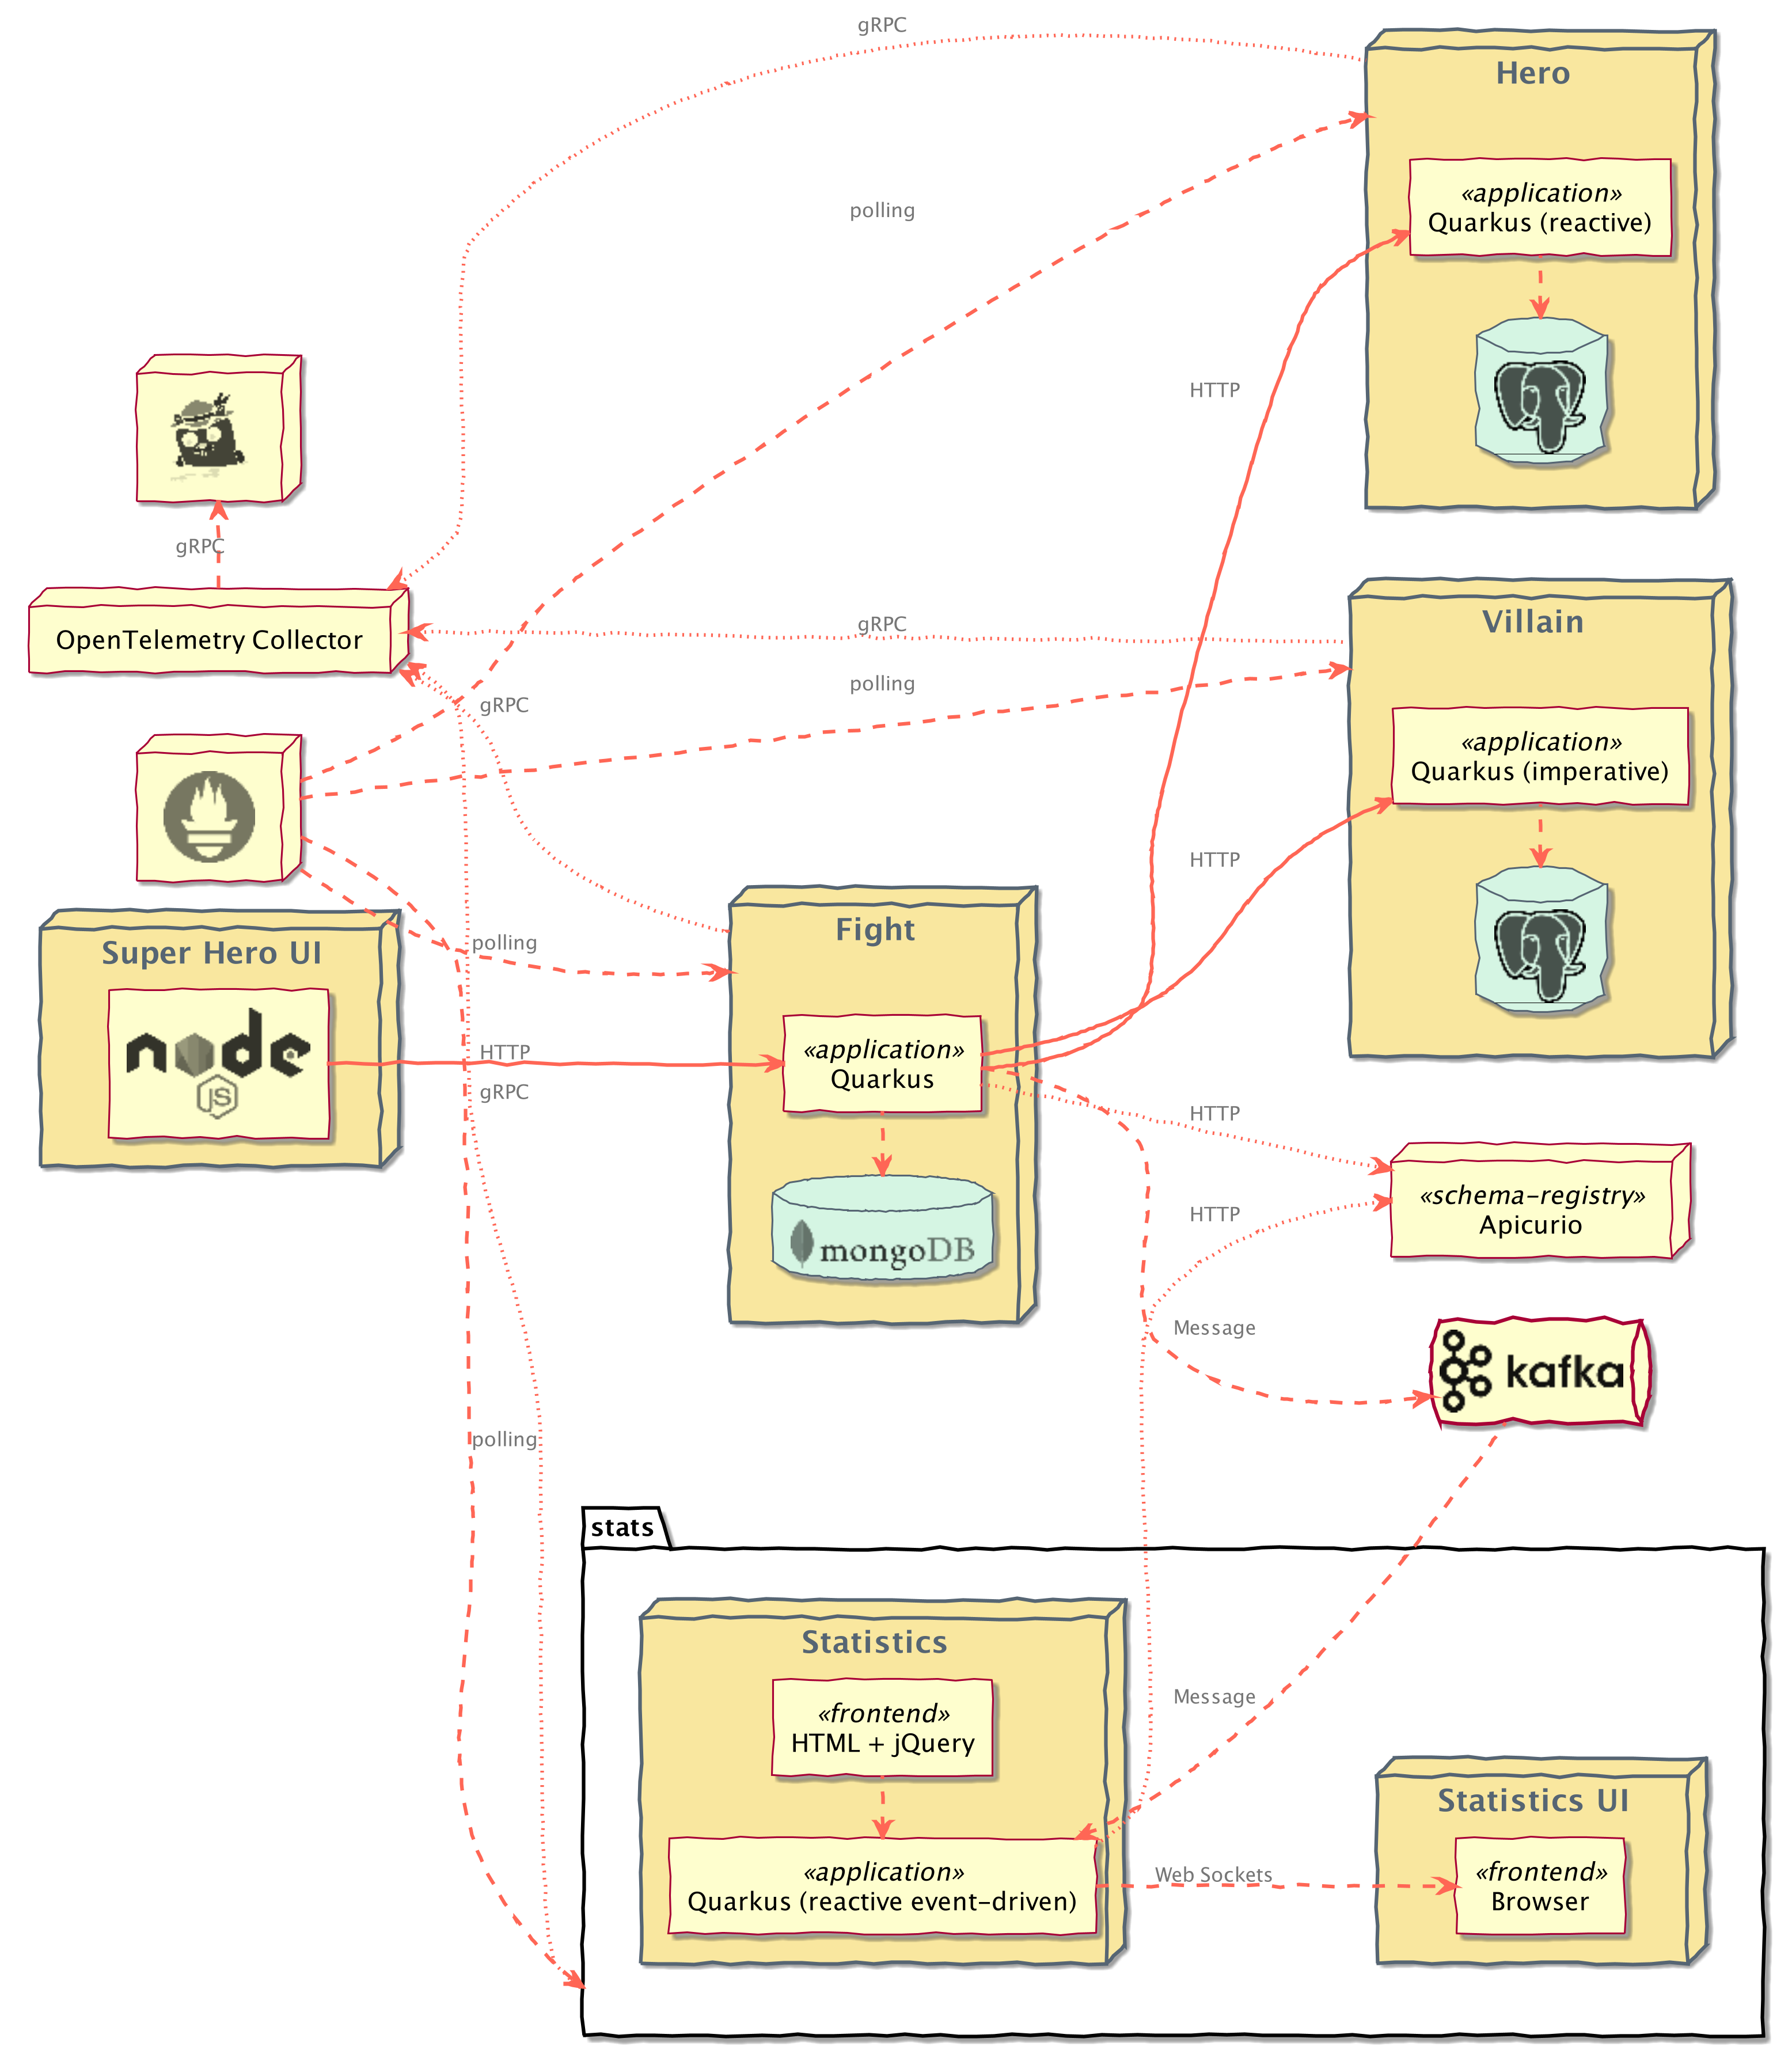
Here is an architecture diagram of the application:
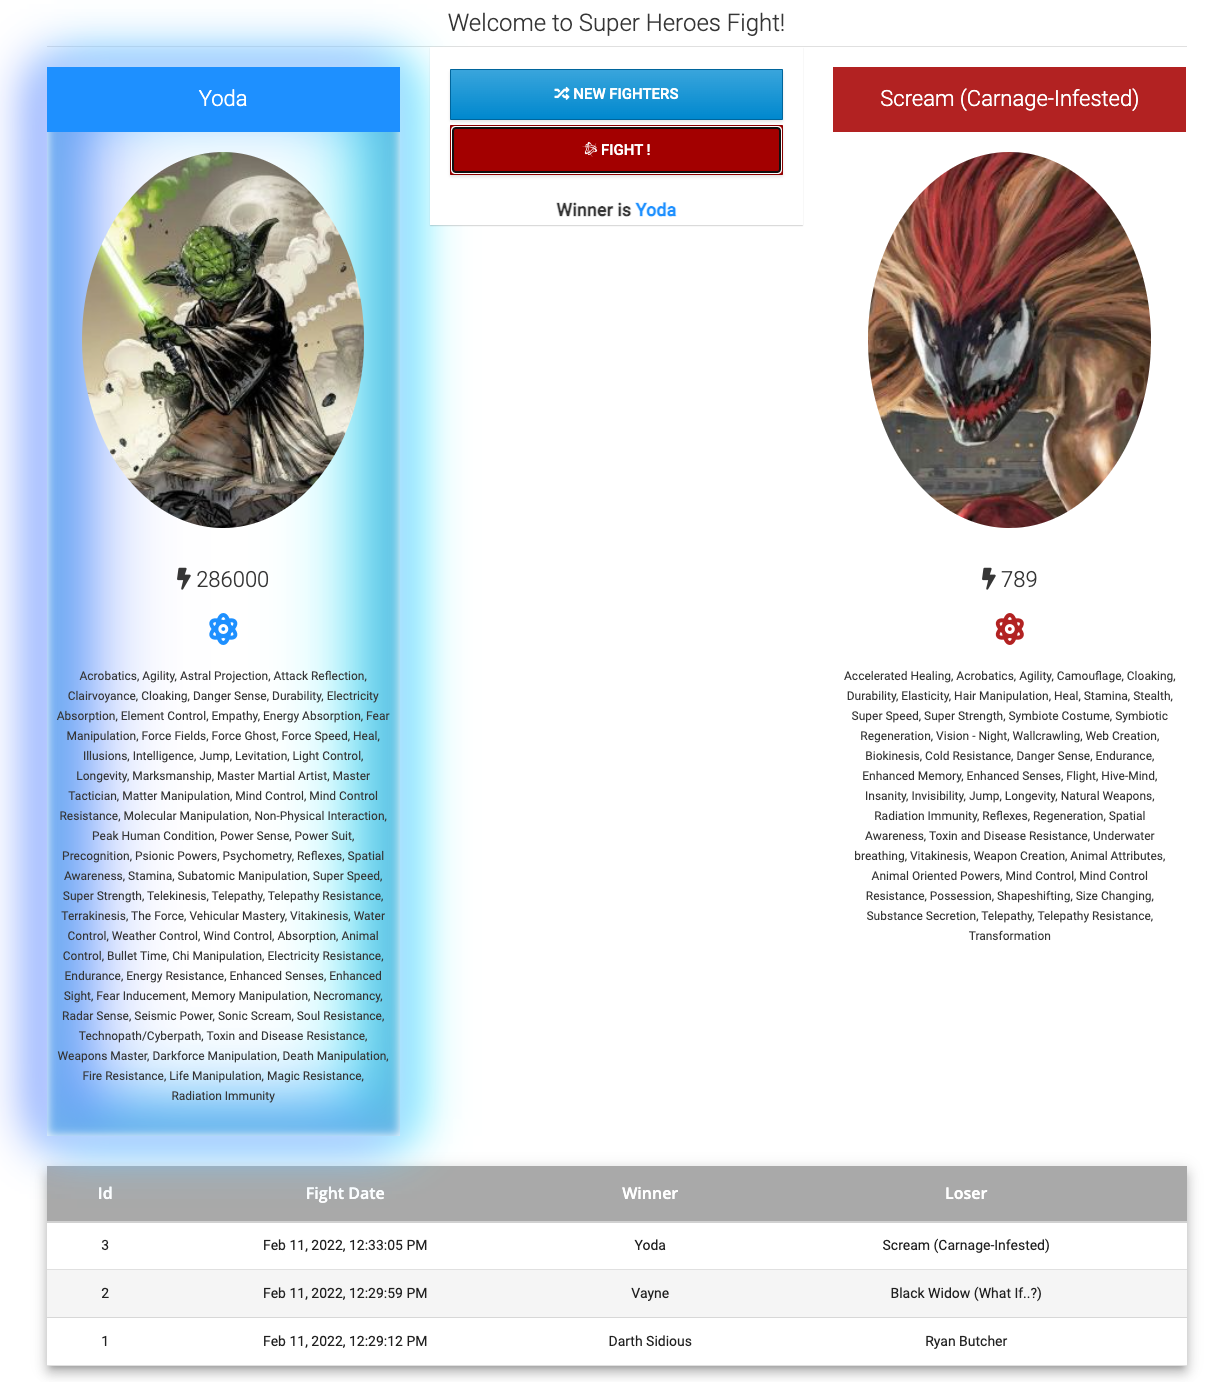
The main UI allows you to pick one random Hero and Villain by clicking on New Fighters. Then, click Fight! to start the battle. The table at the bottom shows the list of previous fights.
Pre-built images for all of the applications in the system can be found at quay.io/quarkus-super-heroes.
Pick one of the 4 versions of the application from the table below and execute the appropriate docker compose command from the quarkus-super-heroes directory.
NOTE: You may see errors as the applications start up. This may happen if an application completes startup before one if its required services (i.e. database, kafka, etc). This is fine. Once everything completes startup things will work fine.
There is a
watch-services.shscript that can be run in a separate terminal that will watch the startup of all the services and report when they are all up and ready to serve requests.
| Description | Image Tag | Docker Compose Run Command | Docker Compose Run Command with Monitoring |
|---|---|---|---|
| JVM Java 11 | java11-latest |
docker compose -f deploy/docker-compose/java11.yml up --remove-orphans |
docker compose -f deploy/docker-compose/java11.yml -f deploy/docker-compose/monitoring.yml up --remove-orphans |
| JVM Java 17 | java17-latest |
docker compose -f deploy/docker-compose/java17.yml up --remove-orphans |
docker compose -f deploy/docker-compose/java17.yml -f deploy/docker-compose/monitoring.yml up --remove-orphans |
| Native compiled with Java 11 | native-java11-latest |
docker compose -f deploy/docker-compose/native-java11.yml up --remove-orphans |
docker compose -f deploy/docker-compose/native-java11.yml -f deploy/docker-compose/monitoring.yml up --remove-orphans |
| Native compiled with Java 17 | native-java17-latest |
docker compose -f deploy/docker-compose/native-java17.yml up --remove-orphans |
docker compose -f deploy/docker-compose/native-java17.yml -f deploy/docker-compose/monitoring.yml up --remove-orphans |
NOTE: If your system does not have the
composesub-command, you can try the above commands with thedocker-composecommand instead ofdocker compose.
Once started the main application will be exposed at http://localhost:8080. If you want to watch the Event Statistics UI, that will be available at http://localhost:8085. The Apicurio Registry will be available at http://localhost:8086.
If you launched the monitoring stack, Prometheus will be available at http://localhost:9090 and Jaeger will be available at http://localhost:16686.
Pre-built images for all of the applications in the system can be found at quay.io/quarkus-super-heroes.
Deployment descriptors for these images are provided in the deploy/k8s directory. There are versions for OpenShift, Minikube, Kubernetes, and KNative.
The only real difference between the Minikube and Kubernetes descriptors is that all the application Services in the Minikube descriptors use type: NodePort so that a list of all the applications can be obtained simply by running minikube service list.
NOTE: If you'd like to deploy each application directly from source to Kubernetes, please follow the guide located within each application's folder (i.e.
event-statistics,rest-fights,rest-heroes,rest-villains).
Both the Minikube and Kubernetes descriptors also assume there is an Ingress Controller installed and configured. There is a single Ingress in the Minikube and Kubernetes descriptors denoting / and /api/fights paths. You may need to add/update the host field in the Ingress as well in order for things to work.
Both the ui-super-heroes and the rest-fights applications need to be exposed from outside the cluster. On Minikube and Kubernetes, the ui-super-heroes Angular application communicates back to the same host and port as where it was launched from under the /api/fights path. See the routing section in the UI project for more details.
On OpenShift, the URL containing the ui-super-heroes host name is replaced with rest-fights. This is because the OpenShift descriptors use Route objects for gaining external access to the application. In most cases, no manual updating of the OpenShift descriptors is needed before deploying the system. Everything should work as-is.
Additionally, there is also a Route for the event-statistics application. On Minikube or Kubernetes, you will need to expose the event-statistics application, either by using an Ingress or doing a kubectl port-forward. The event-statistics application runs on port 8085.
Pick one of the 4 versions of the system from the table below and deploy the appropriate descriptor from the deploy/k8s directory. Each descriptor contains all of the resources needed to deploy a particular version of the entire system.
NOTE: These descriptors are NOT considered to be production-ready. They are basic enough to deploy and run the system with as little configuration as possible. The databases, Kafka broker, and schema registry deployed are not highly-available and do not use any Kubernetes operators for management or monitoring. They also only use ephemeral storage.
For production-ready Kafka brokers, please see the Strimzi documentation for how to properly deploy and configure production-ready Kafka brokers on Kubernetes. You can also try out a fully hosted and managed Kafka service!
For a production-ready Apicurio Schema Registry, please see the Apicurio Registry Operator documentation. You can also try out a fully hosted and managed Schema Registry service!
| Description | Image Tag | OpenShift Descriptor | Minikube Descriptor | Kubernetes Descriptor | KNative Descriptor |
|---|---|---|---|---|---|
| JVM Java 11 | java11-latest |
java11-openshift.yml |
java11-minikube.yml |
java11-kubernetes.yml |
java11-knative.yml |
| JVM Java 17 | java17-latest |
java17-openshift.yml |
java17-minikube.yml |
java17-kubernetes.yml |
java17-knative.yml |
| Native compiled with Java 11 | native-java11-latest |
native-java11-openshift.yml |
native-java11-minikube.yml |
native-java11-kubernetes.yml |
native-java11-knative.yml |
| Native compiled with Java 17 | native-java17-latest |
native-java17-openshift.yml |
native-java17-minikube.yml |
native-java17-kubernetes.yml |
native-java17-knative.yml |
There are also Kubernetes deployment descriptors for monitoring with OpenTelemetry, Prometheus, and Jaeger in the deploy/k8s directory (monitoring-openshift.yml, monitoring-minikube.yml, monitoring-kubernetes.yml). Each descriptor contains the resources necessary to monitor and gather metrics and traces from all of the applications in the system. Deploy the appropriate descriptor to your cluster if you want it.
The OpenShift descriptor will automatically create Routes for Prometheus and Jaeger. On Kubernetes/Minikube you may need to expose the Prometheus and Jaeger services in order to access them from outside your cluster, either by using an Ingress or by using kubectl port-forward. On Minikube, the Prometheus and Jaeger Services are also exposed as a NodePort.
NOTE: These descriptors are NOT considered to be production-ready. They are basic enough to deploy Prometheus, Jaeger, and the OpenTelemetry Collector with as little configuration as possible. They are not highly-available and does not use any Kubernetes operators for management or monitoring. They also only uses ephemeral storage.
For production-ready Prometheus instances, please see the Prometheus Operator documentation for how to properly deploy and configure production-ready instances.
For production-ready Jaeger instances, please see the Jaeger Operator documentation for how to properly deploy and configure production-ready instances.
For production-ready OpenTelemetry Collector instances, please see the OpenTelemetry Operator documentation for how to properly deploy and configure production-ready instances.
By now you've performed a few battles, so let's analyze the telemetry data. Open the Jaeger UI based on how you are running the system, either through Docker Compose or by deploying the monitoring stack to kubernetes.
Now, let's analyze the traces for when requesting new fighters.
When clicking the New Fighters button in the Superheroes UI, the browser makes an HTTP request to the /api/fights/randomfighters endpoint within the rest-fights application.
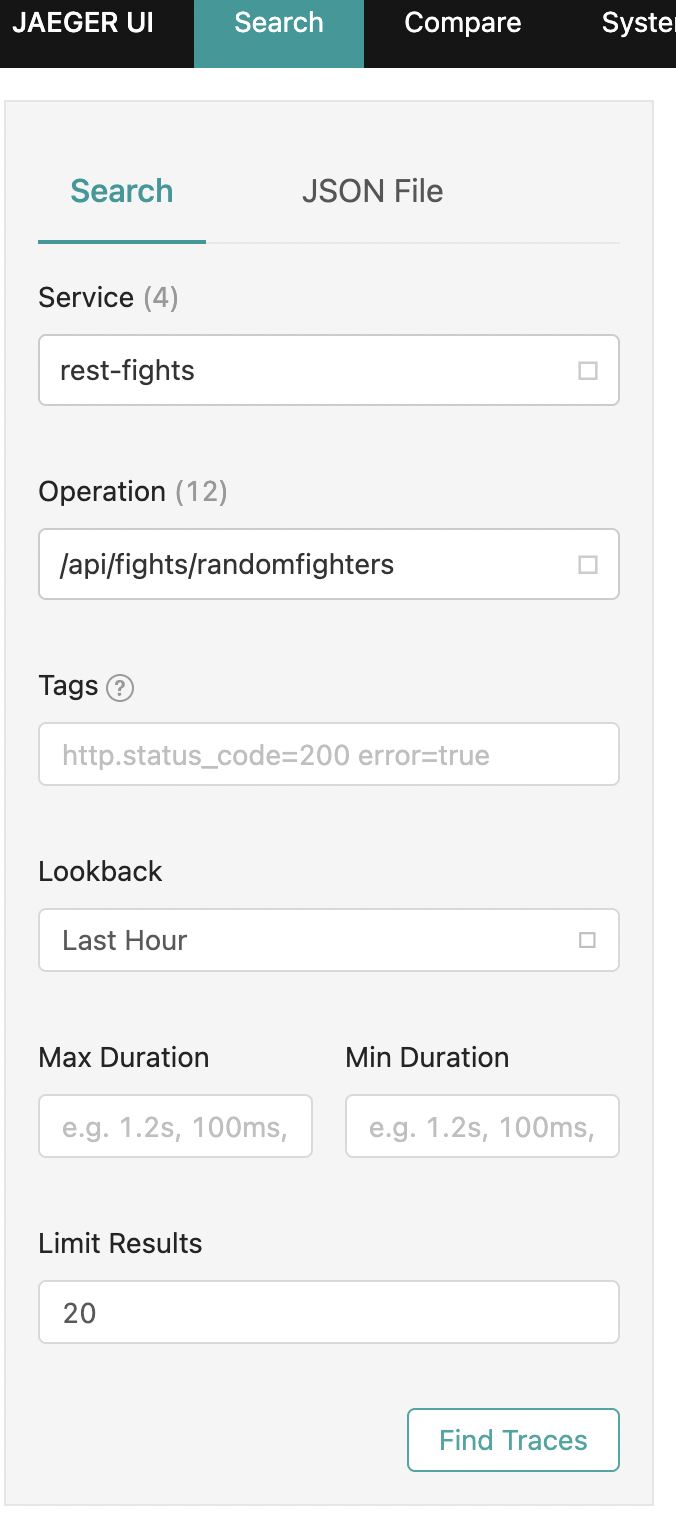
In the Jaeger UI, select rest-fights for the Service and /api/fights/randomfighters for the Operation, then click Find Traces.
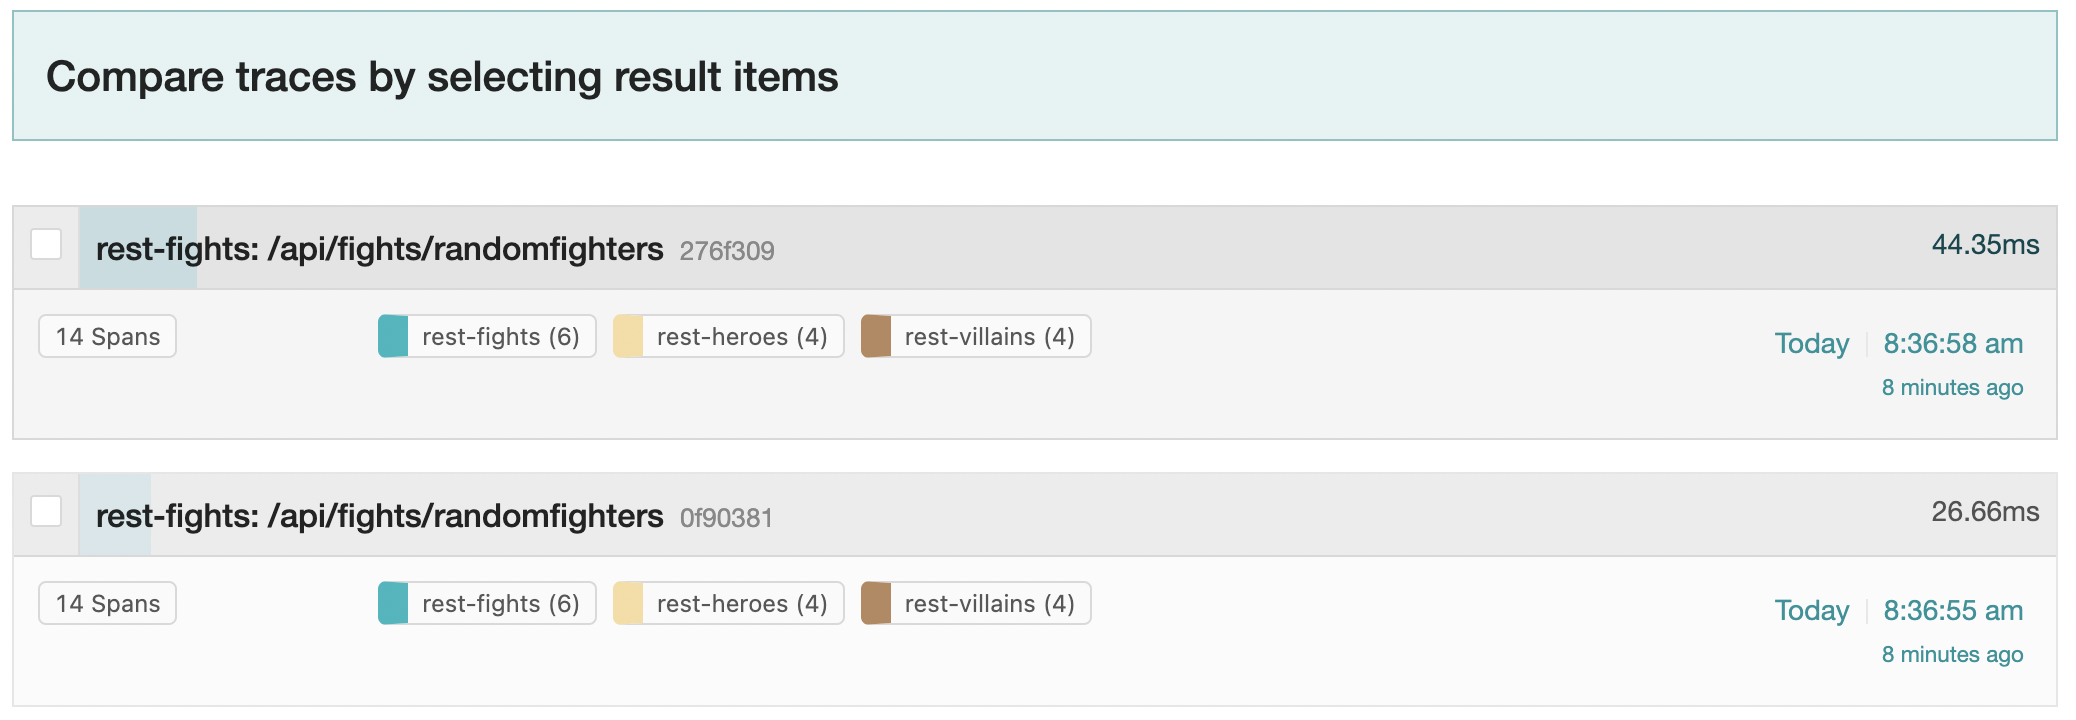
You should see all the traces corresponding to the request of getting new fighters.
Then, select one trace.
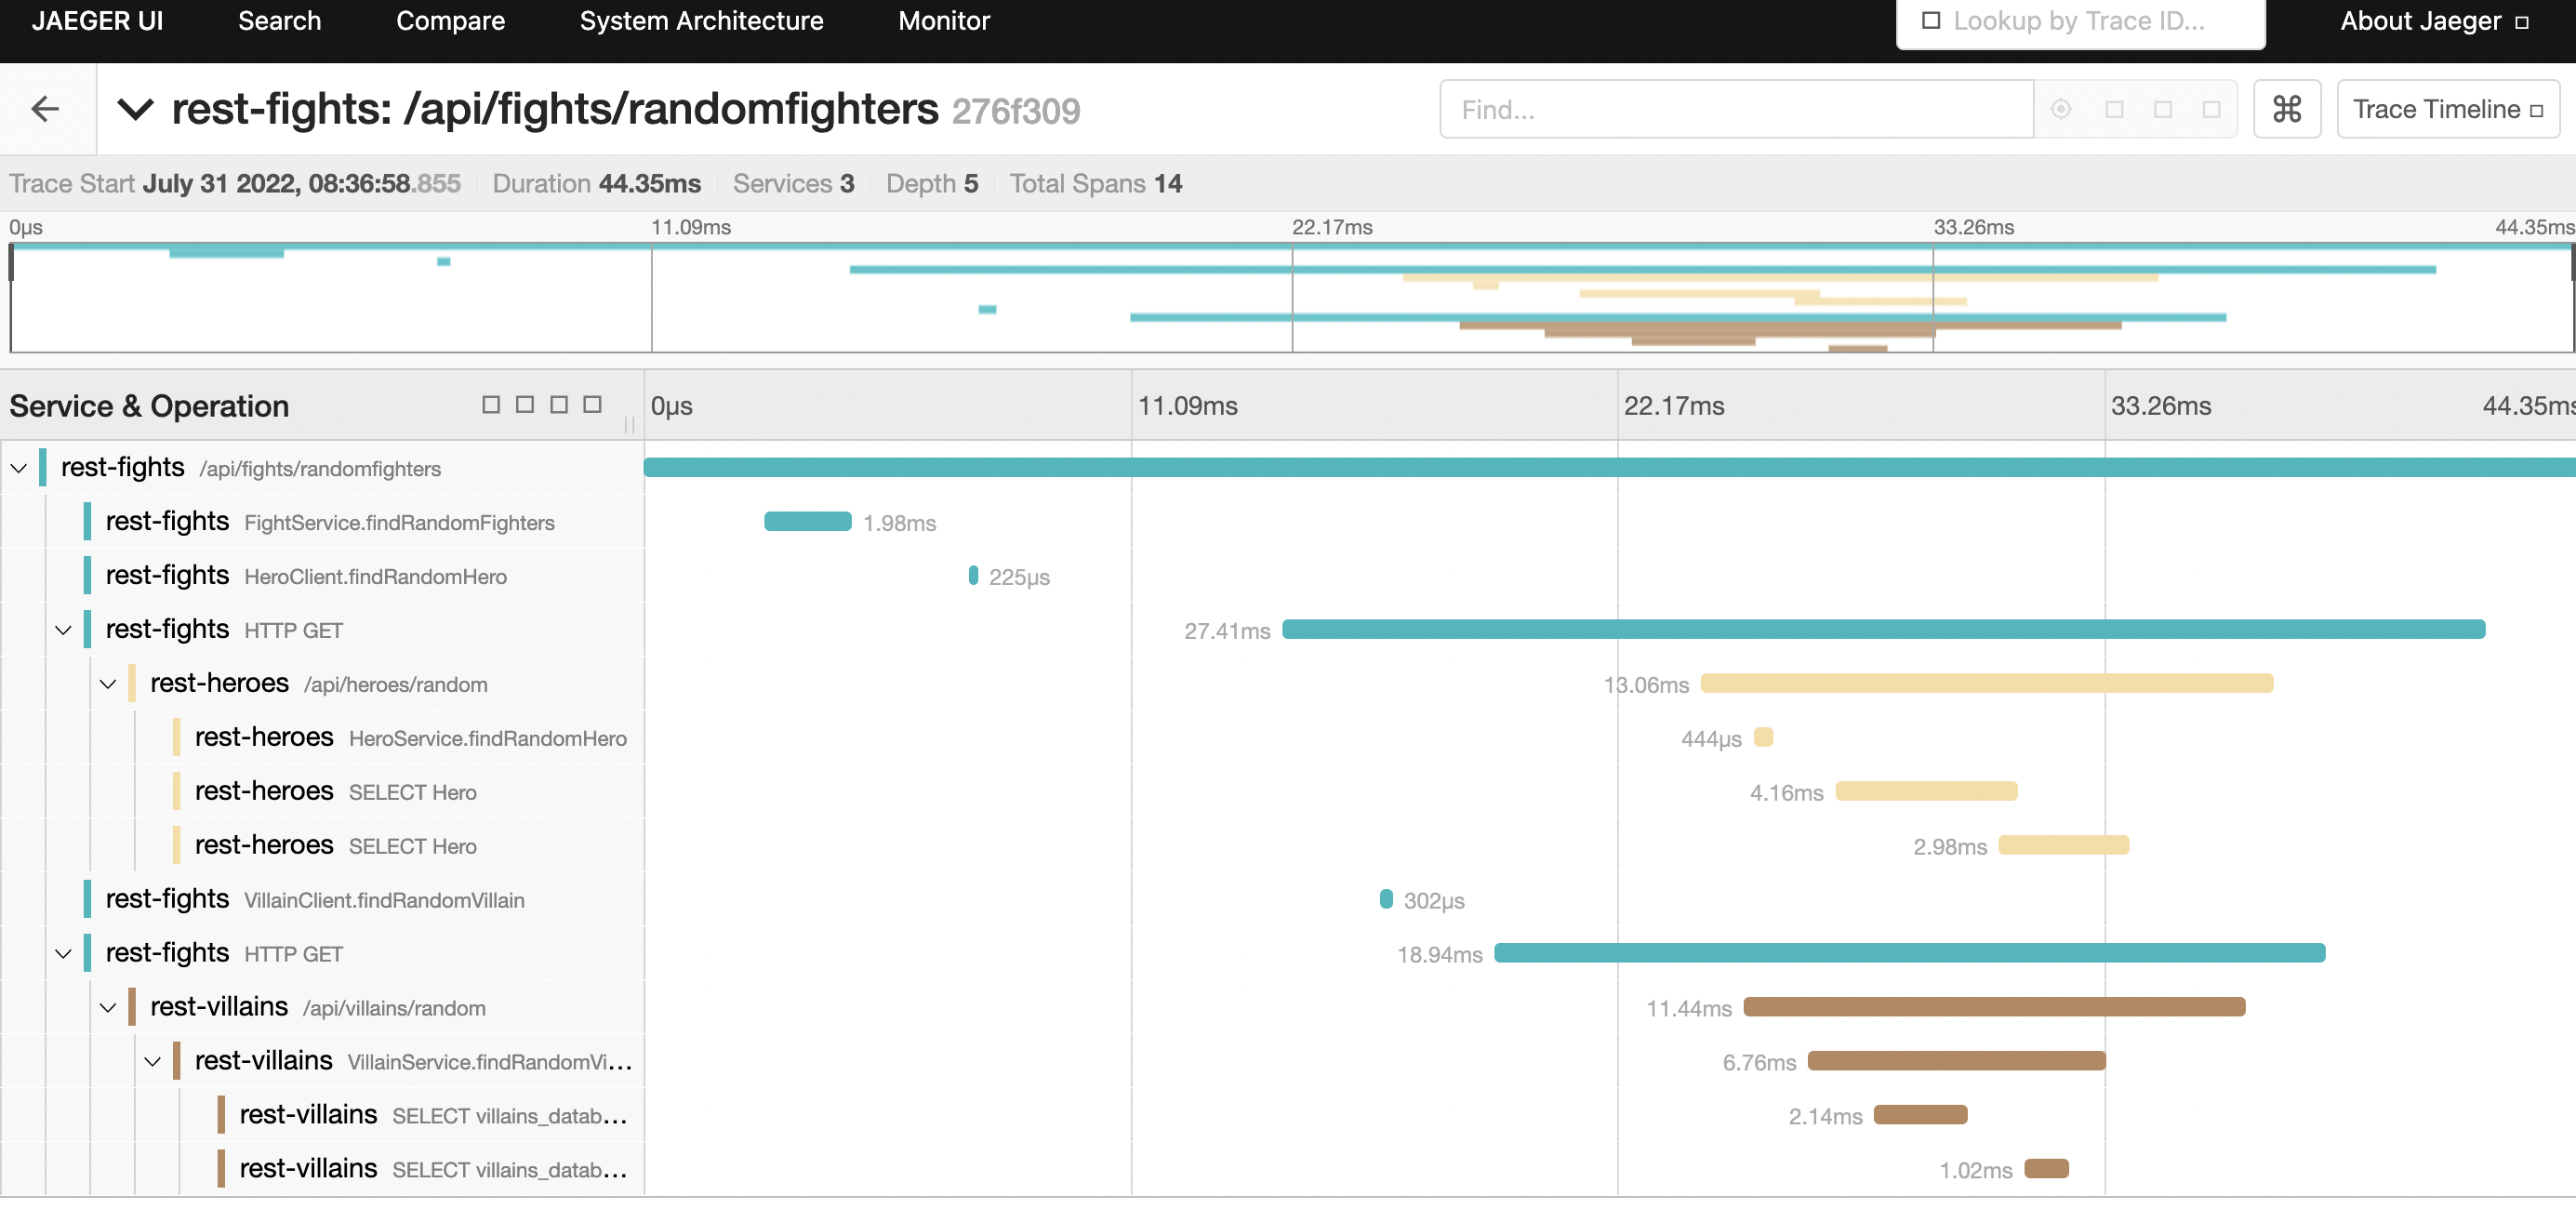
A trace consists of a series of spans.
Each span is a time interval representing a unit of work.
Spans can have a parent/child relationship and form a hierarchy.
You can see that each trace contains 14 total spans:
six spans in the rest-fights application, four spans in the rest-heroes application, and four spans in the rest-villains application.
Each trace also provides the total round-trip time of the request into the /api/fights/randomfighters endpoint within the rest-fights application and the total time spent within each unit of work.
