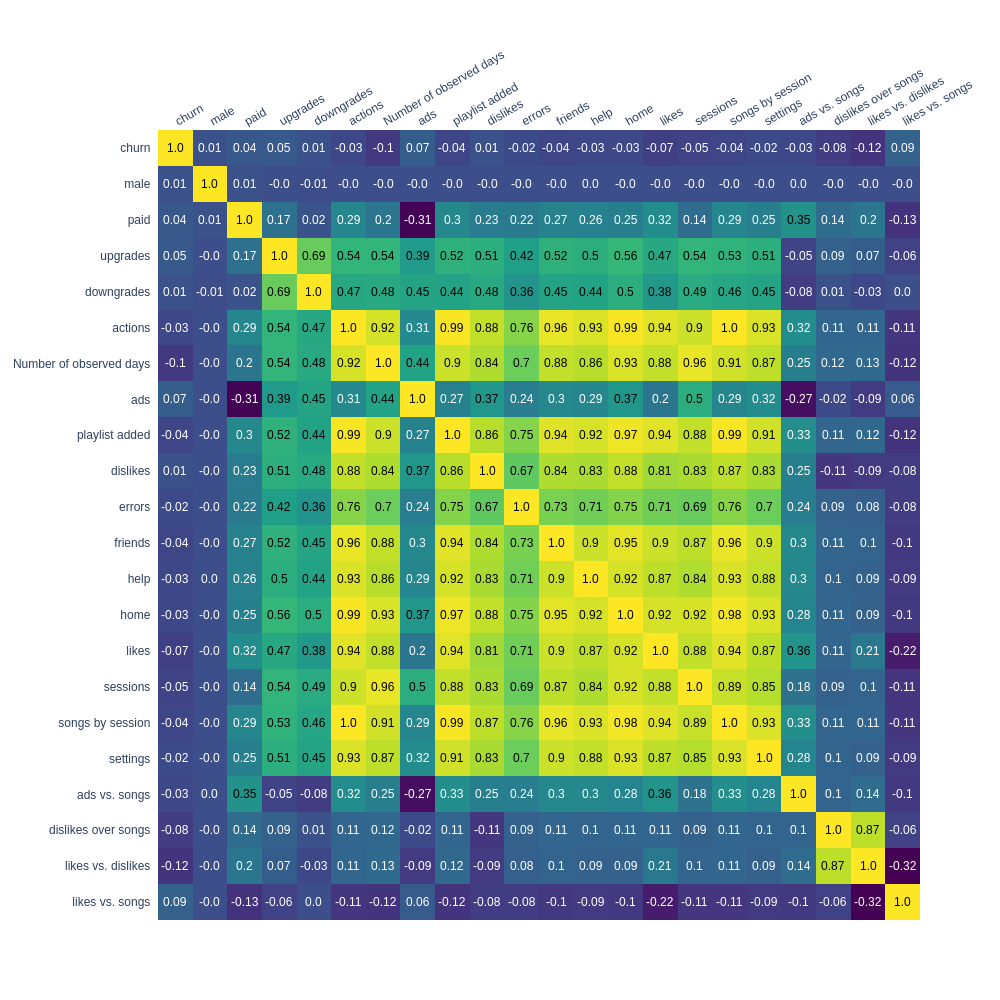
At this project, we predict churn for a fictional streaming service called Sparkify.
The complete analysis and discussion are available here.
- Python 3
- The comple list of requirents can be found at
requirements.txt
At this project, we try to predict if a user will churn (Canceling the service) given some information regarding the service interactions.
In the future, we can try to predict if the user will Downgrade the subscription (became a free user).
I've applied four classification algorithms and several techniques to work with the data.
To allow an easy visualization, I've hosted the notebook HTML files online, so you will see a static version, without the need to open the .ipynb at the GitHub (which is usually slow and hangs for large files).
- The notebook with the training process;
- The result analysis - For all the algorithms and metrics;
- The data exploration (with the raw data and the final version with the new engineered features).
To a more complete analysis, I recommend check my article here.
.
├── results/ # Folder with the static version of the notebooks - Also hosted online (See at the project overview)
├── pyspark.sh # The file to run and config PySpark for local mode
├── visualizations.py # The implementation of some visualizations on Plotly, for a more interactive heatmap (See on the data exploration notebook)
├── jupyter_utils.py # A script to config pandas for a standard view between all the notebooks
├── Data Exploration.ipynb # Notebook with the exploration of the raw data and after the feature engineering
├── Sparkify.ipynb # Notebook with the exploration and feature engineering
├── Results - Spark.ipynb # Notebook with all the visualizations related to the results of training and the GridSearch
├── requirements.txt # The project dependencies
The dataset was given by Udacity. I've hosted on my S3 to make it more comfortable to download and work between my environments.
-
The full dataset is available here - 12Gb:
-
I've created a small version without some columns (firstName, lastName, location, userAgent), but with all the events - available here - 2Gb.
Raw Dataset features
ts: Event timestamp in millisecondsgender: M or FfirstName: First name of the userlastName: Last name of the userlength: Length of the songlevel: Level of subscriptionfreeorpaid.registration: User registration timestampuserId: User id at the serviceauth: If the user is loggedpage: Action of the event (next song, thumps up, thumbs down)sessionId: Id of the sessionlocation: Location of the eventuserAgent: Browser/web agent of the eventsong: Name of the songartist: Name of the artistmethod: HTTP method of the eventstatus: HTTP status of the request (200, 404)
To run the training code, you can run the pyspark.sh. file, then just go to the Sparkify notebook.
The next step is to decide which version of the data will fit you. For example, there are three variations of the load file.
The medium dataset, the entire dataset as JSON, or the entire dataset as CSV (my version of it, as I've mentioned at the files section).
To running locally, I recommend downloading the dataset, so you won't need to download each time with Spark.
If you want to run the visualizations, don't forget to install the requirements, especially the plotly lib.


