A Drupal 8/9 module that provides a collection of reports on various aspects of an Islandora repository. This module's goal is to provide Islandora repository administrators with a set of visual reports that work with little, or no, configuration. It is not a replacment for Views.
Reports included in this module are:
- number of nodes, grouped by collection
- number of nodes, grouped by Drupal content type
- number of nodes, grouped by month created
- number of nodes, grouped by terms from the Islandora Models taxonomy
- number of nodes, grouped by terms from the Islandora Genre taxonomy
- number of media, grouped by MIME type
- number of media, grouped by Islandora Media Use taxonomy
- number of unique values in a node field (string/text field types only)
- disk usage, grouped by Drupal filesystem (e.g., Fedora, public, private), MIME type, or collection
- disk usage by month
Also included are several optional submodules (each needs be enabled separately) that:
- allow the user to generate a report on the usage of terms in any taxonomy/vocabulary
- allow the user to generate a report on the entries in the Drupal system log
- allow the user to generate a report on the number of OAI-PMH harvests, grouped by month
- allow the user to see the number of pending messages in ActiveMQ queues
- allow the user to generate a report on collection-level usage, using Matomo data
- provide access to the Matomo dashboard from within the Islandora Repository Reports interface. See its README for more information.
- provide access to the failed fixity check events report generated by Islandora Riprap from within the Islandora Repository Reports interface. See its README for more information.
- provide access to the Islandora Bagger queue and to the list of Bags registered with Islandora Bagger Integration. See its README for more information.
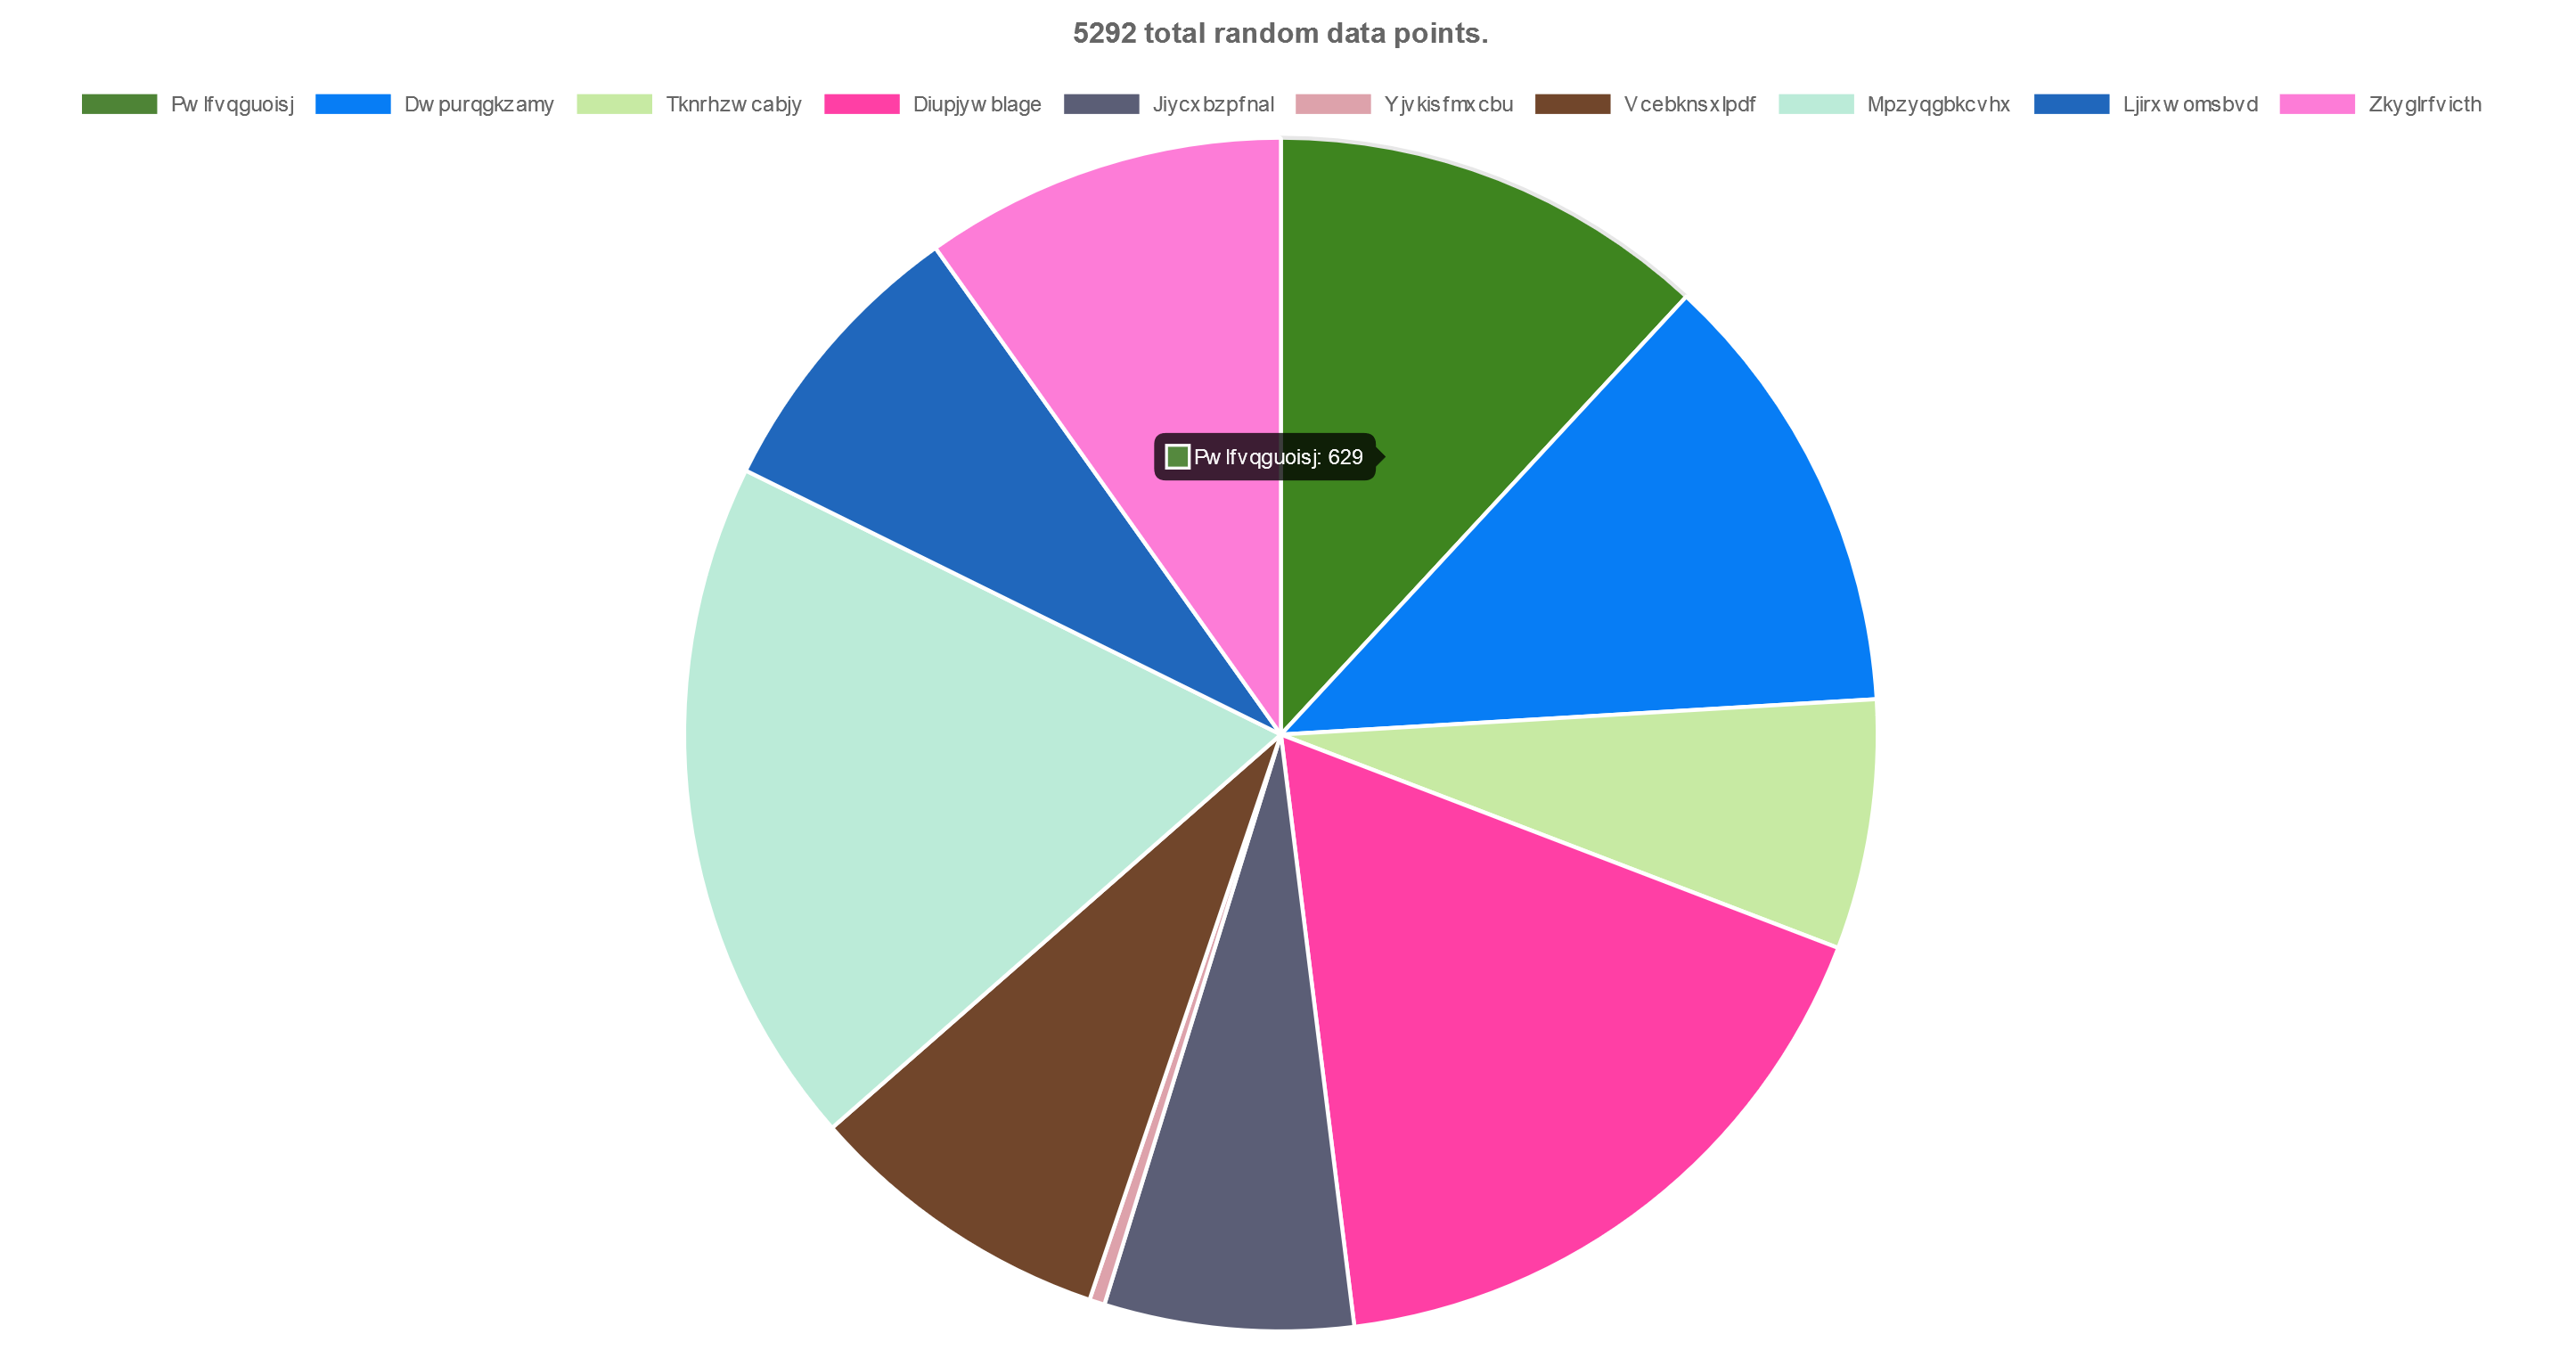
Users with "View Repository Reports" permission can visit the reports page from Drupal's Reports list (admin/reports), or, if they don't have permission to view the Reporst list, they can link to it directly at admin/reports/islandora_repository_reports. Selecting one of the available reports, and then clicking on the "Go" button, will produce a pie chart, like this one:
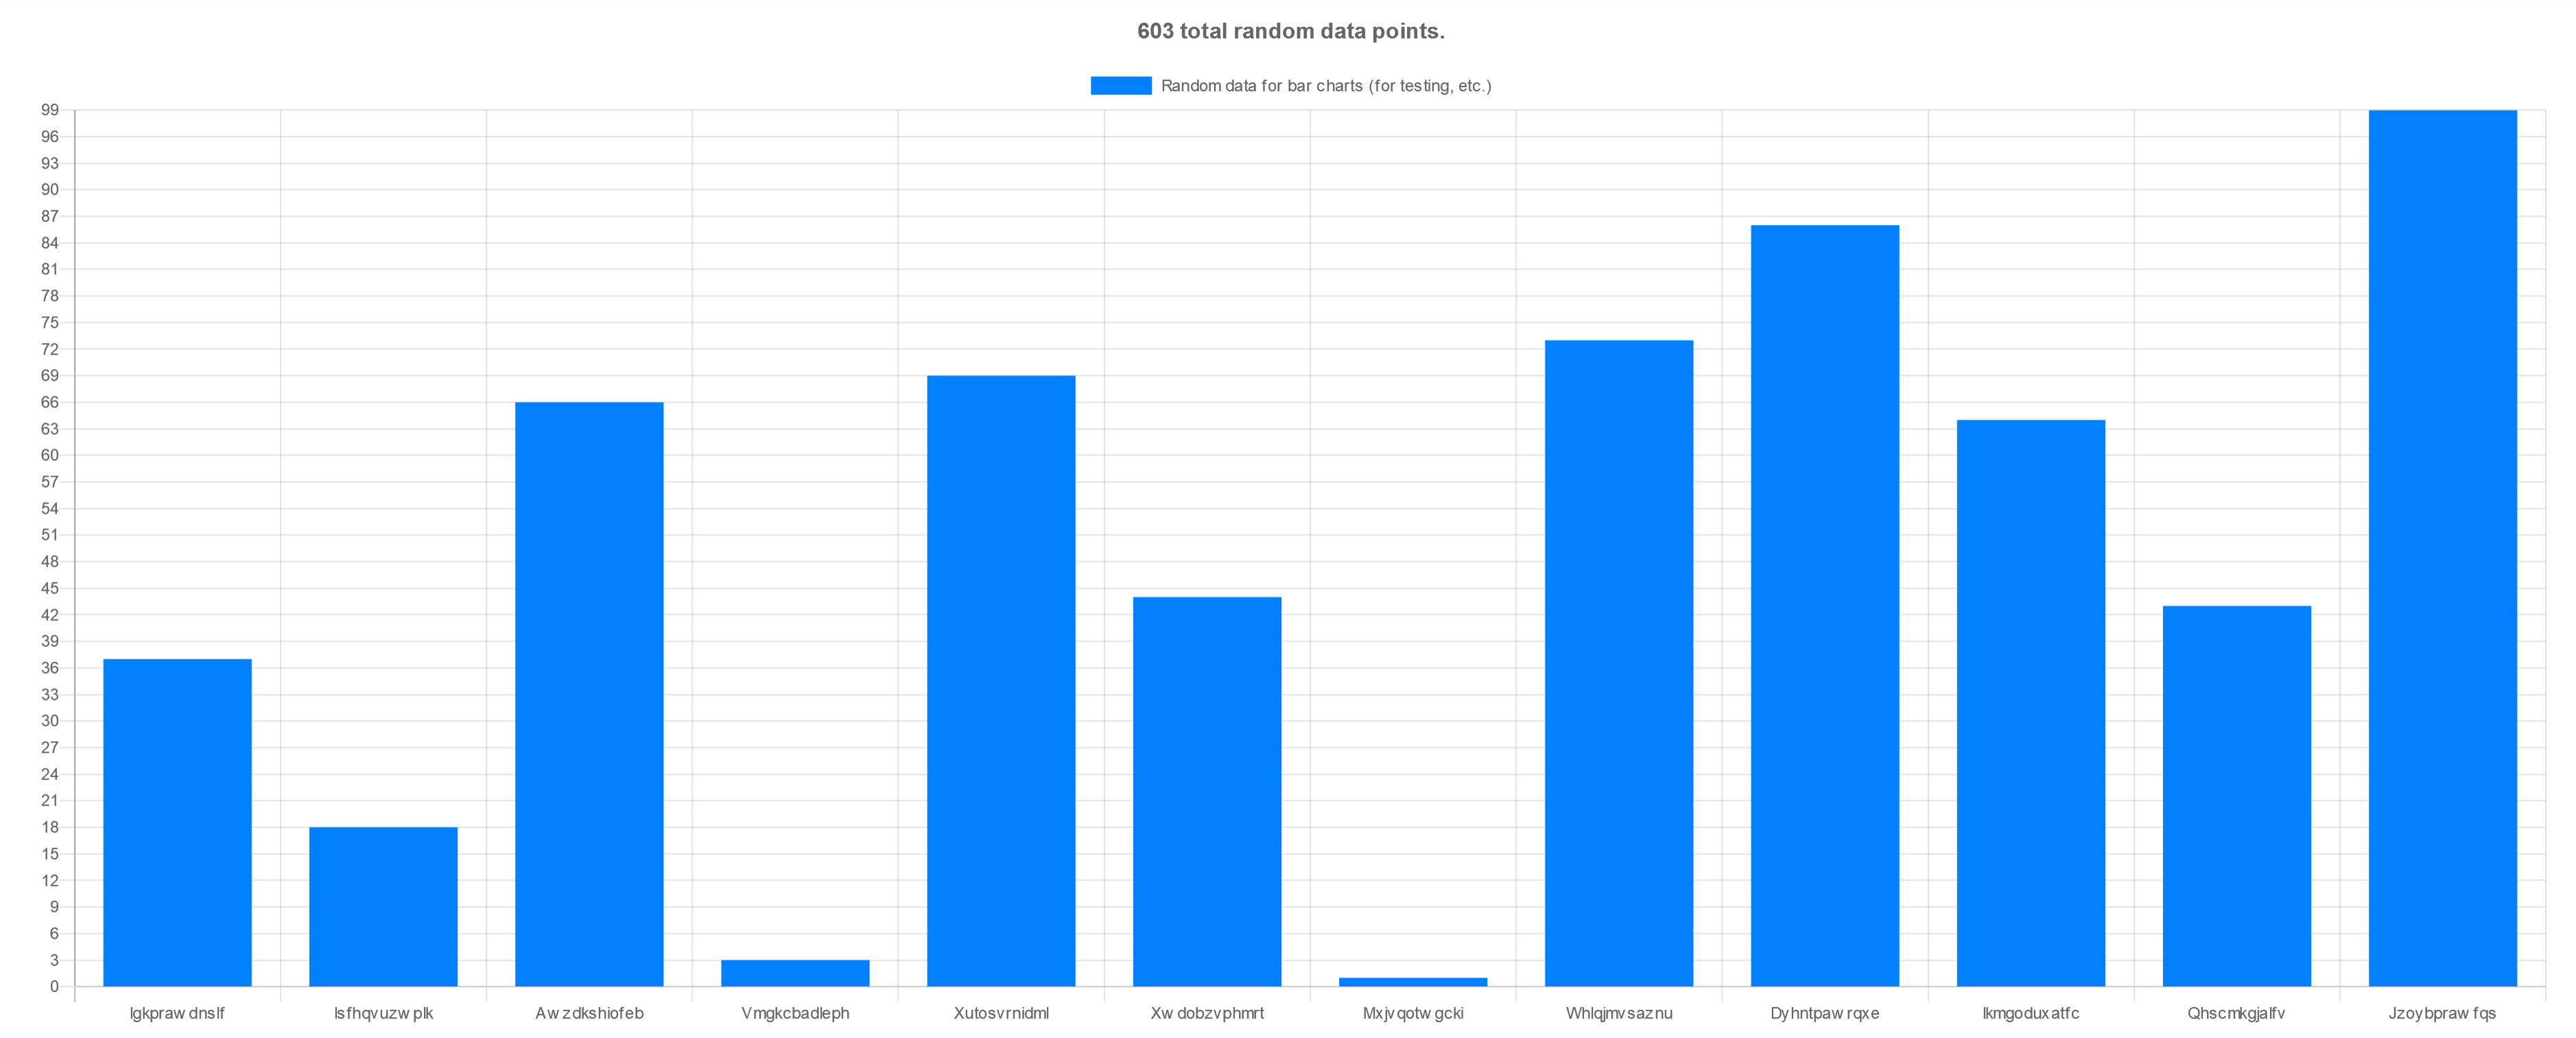
Or a bar chart, like this one:
All reports allow the user to "Generate a CSV file of this data" by checking a box before clicking on the "Go" button. If this box is checked, a link to download the CSV file will appear.
Islandora Repository Reports is ready for for Drupal 9.
- Clone this repo into your Islandora's
drupal/web/modules/contribdirectory. - Enable the module either under the "Admin > Extend" menu or by running
drush en -y islandora_repository_reports.
Configuration options (pie vs. doughnut, color options, caching) are available in the "Islandora" config group, or directly at admin/config/islandora/islandora_repository_reports. Some additional coniguration-related notes:
- Users will need to have "View Repository Reports" permission to view the reports page.
- Options selected by the user within the form used to select which report to generate are specific to each Drupal user. They are not set by the site administrator for all users.
- On installation, a block containing some "tips" on using the reports is installed. If Seven is your administrative theme, this block will be placed at the bottom of the Repository Reports page.
Generally speaking, as the size of your repository grows, the longer it will take to generate the data that is visualized in the charts. If you choose to cache your reports data, you can pregenerate the data to make the charts render in a reasonable amount of time. This module comes with a set of Drush commands that generates the data used in the reports and caches it:
- To list the enabled report types:
drush islandora_repository_reports:list_report_types - To pregenerate the data for the 'model' report:
drush islandora_repository_reports:build_cache model - To delete the data for the 'mimetype' report:
drush islandora_repository_reports:delete_cache mimetype
Note that the Drush command that generates the cached data uses the chart options that the user most recently selected via the report selection form at admin/reports/islandora_repository_reports. Chart options cannot be passed into the Drush command (although there is an open issue to add that ability).
This module is intended to be easy for repository admins to use, and also for developers to extend. Writing submodules that provide data source plugins is fairly straight forward.
Contributing to this module will increase your awesomeness.

