Error in prep_tbl_time()
Opened this issue · 2 comments
bettyliao776 commented
Hi, I run the sample code from https://github.com/business-science/anomalize and there's an issue. Please see below:
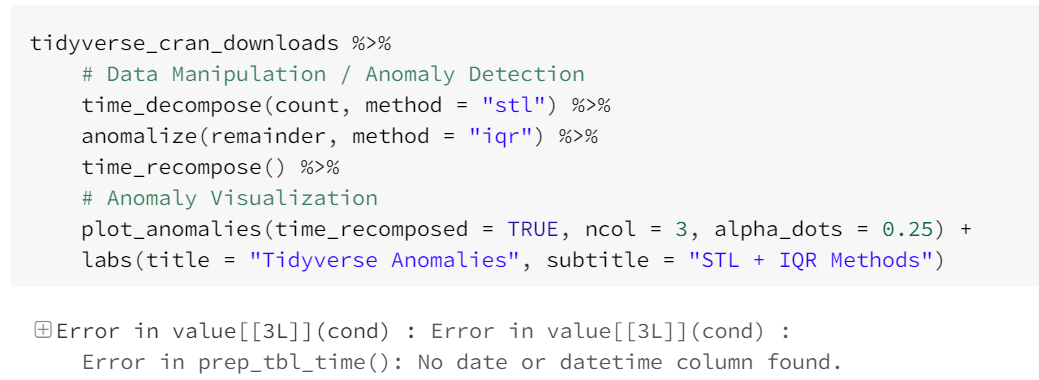
I tried the same code on my own tibble table and I got the same error:
Error in value[3L] : Error in value[3L] :
Error in prep_tbl_time(): No date or datetime column found.
mitchhitch commented
I have the exact same issue and this whole package is useless without this function.
mdancho84 commented
Hey, I'm sorry about this. I'm transitioning most of this functionality over to timetk so you may have better luck with that. I'm not in a position to work on anomalize (my apologies). I'd try:
library(timetk)
library(tidyverse)

# Get Anomaly Data
walmart_sales_weekly %>%
    group_by(id) %>%
    tk_anomaly_diagnostics(
        .date_var = Date,
        .value    = Weekly_Sales
    )
#> frequency = 13 observations per 1 quarter
#> trend = 52 observations per 1 year
#> frequency = 13 observations per 1 quarter
#> trend = 52 observations per 1 year
#> frequency = 13 observations per 1 quarter
#> trend = 52 observations per 1 year
#> frequency = 13 observations per 1 quarter
#> trend = 52 observations per 1 year
#> frequency = 13 observations per 1 quarter
#> trend = 52 observations per 1 year
#> frequency = 13 observations per 1 quarter
#> trend = 52 observations per 1 year
#> frequency = 13 observations per 1 quarter
#> trend = 52 observations per 1 year
#> # A tibble: 1,001 x 12
#> # Groups:   id [7]
#>    id    Date       observed season  trend remainder seasadj remainder_l1
#>    <fct> <date>        <dbl>  <dbl>  <dbl>     <dbl>   <dbl>        <dbl>
#>  1 1_1   2010-02-05   24924.   874. 19967.     4083.  24050.      -15981.
#>  2 1_1   2010-02-12   46039.  -698. 19835.    26902.  46737.      -15981.
#>  3 1_1   2010-02-19   41596. -1216. 19703.    23108.  42812.      -15981.
#>  4 1_1   2010-02-26   19404.  -821. 19571.      653.  20224.      -15981.
#>  5 1_1   2010-03-05   21828.   324. 19439.     2064.  21504.      -15981.
#>  6 1_1   2010-03-12   21043.   471. 19307.     1265.  20572.      -15981.
#>  7 1_1   2010-03-19   22137.   920. 19175.     2041.  21217.      -15981.
#>  8 1_1   2010-03-26   26229.   752. 19069.     6409.  25478.      -15981.
#>  9 1_1   2010-04-02   57258.   503. 18962.    37794.  56755.      -15981.
#> 10 1_1   2010-04-09   42961.  1132. 18855.    22974.  41829.      -15981.
#> # … with 991 more rows, and 4 more variables: remainder_l2 <dbl>,
#> #   anomaly <chr>, recomposed_l1 <dbl>, recomposed_l2 <dbl>

# Plot Anomalies
walmart_sales_weekly %>%
    group_by(id) %>%
    plot_anomaly_diagnostics(
        .date_var    = Date,
        .value       = Weekly_Sales,
        .facet_ncol  = 2,
        .interactive = FALSE
    )
#> frequency = 13 observations per 1 quarter
#> trend = 52 observations per 1 year
#> frequency = 13 observations per 1 quarter
#> trend = 52 observations per 1 year
#> frequency = 13 observations per 1 quarter
#> trend = 52 observations per 1 year
#> frequency = 13 observations per 1 quarter
#> trend = 52 observations per 1 year
#> frequency = 13 observations per 1 quarter
#> trend = 52 observations per 1 year
#> frequency = 13 observations per 1 quarter
#> trend = 52 observations per 1 year
#> frequency = 13 observations per 1 quarter
#> trend = 52 observations per 1 year
Created on 2020-11-13 by the reprex package (v0.3.0)