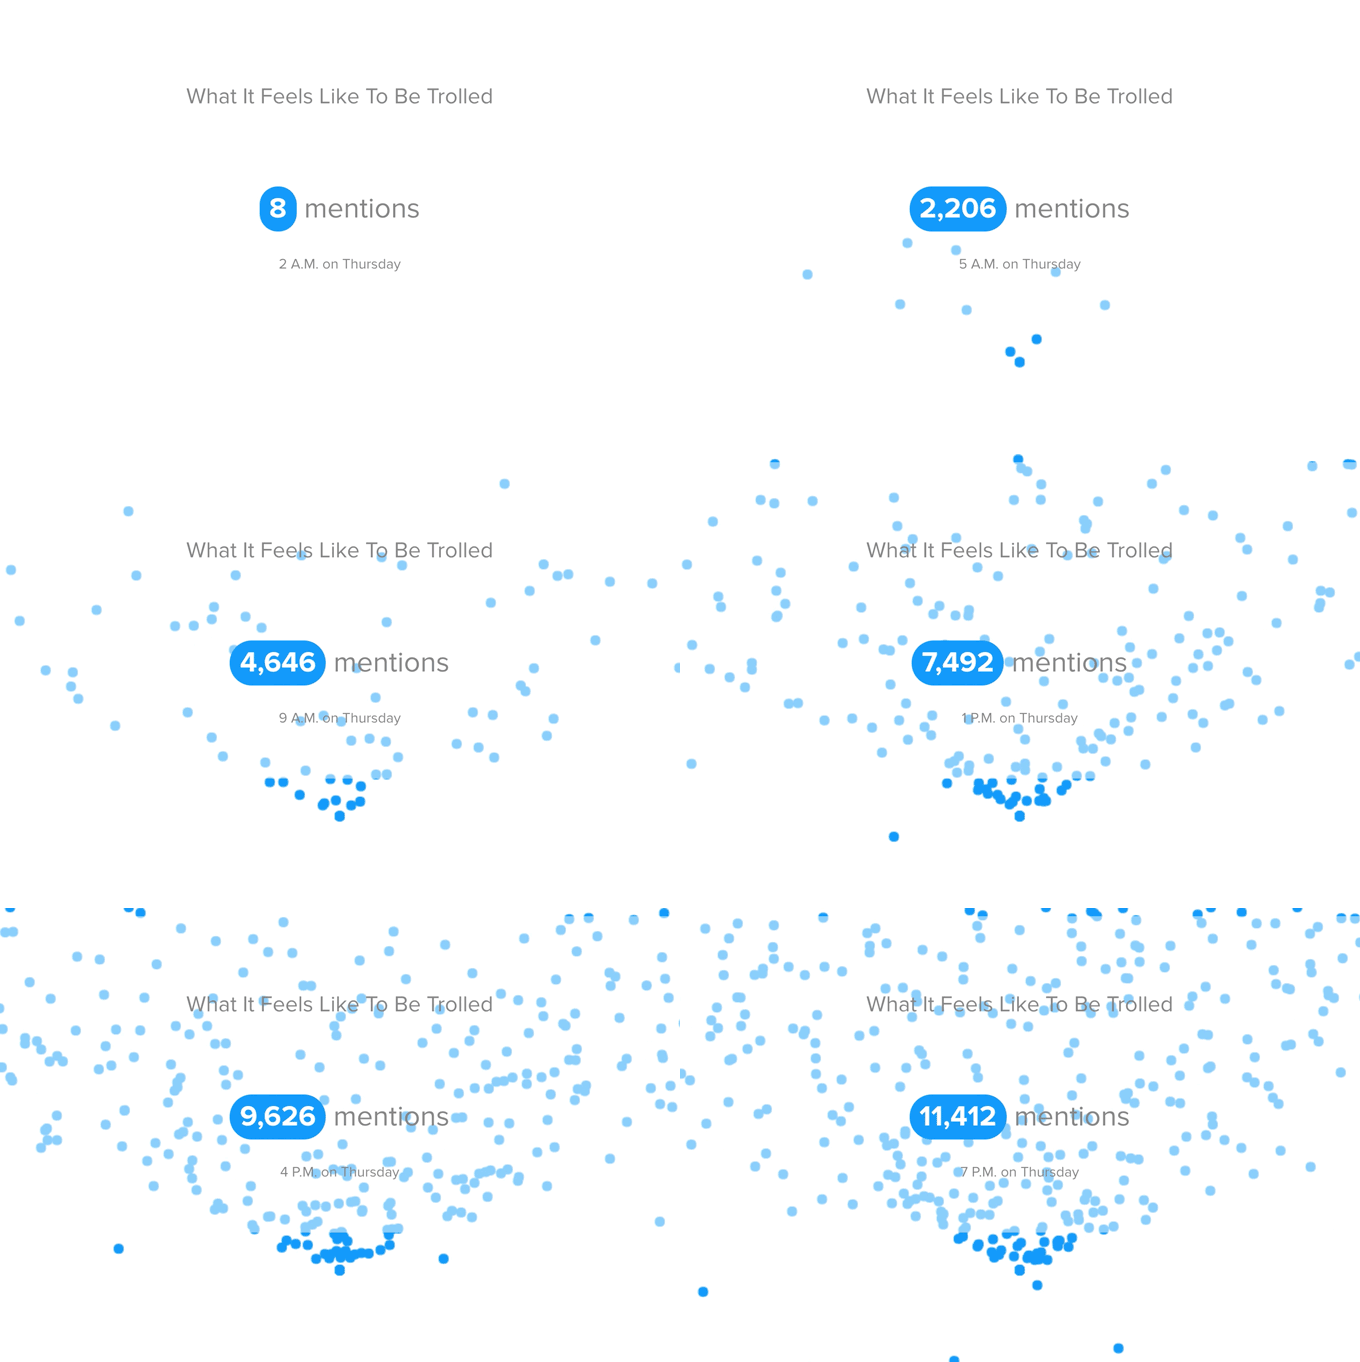
For a story about online trolling, we at the BuzzFeed Open Lab put together an animated data visualization. This is the cleaned up code for this project.
Visualizing more than a few thousand data points in d3.js can get a little heavy on the browser because you have to animate thousands of <svg> elements. Using <canvas> allows you to manipulate and update pixels instead.
The code for this project came from an in-class exercise for a JavaScript class. I’ve modified the project to make this graphic.
The original code is from Eric Haseltine, the JavaScript instructor who introduced me to the joy of canvas and who graciously helped templatize this emitter. ٩(◕‿◕。)۶
For this project you need underscore.js and JQuery for the counter. The canvas animation is written in JavaScript.
<script src="js/libs/jquery-2.1.3.min.js"></script>
<script src="js/libs/underscore-1.6.0.min.js" type="text/javascript" charset="utf-8"></script>
To make your own version of this project you will need to modify two of the files: the data.js and script.js files.
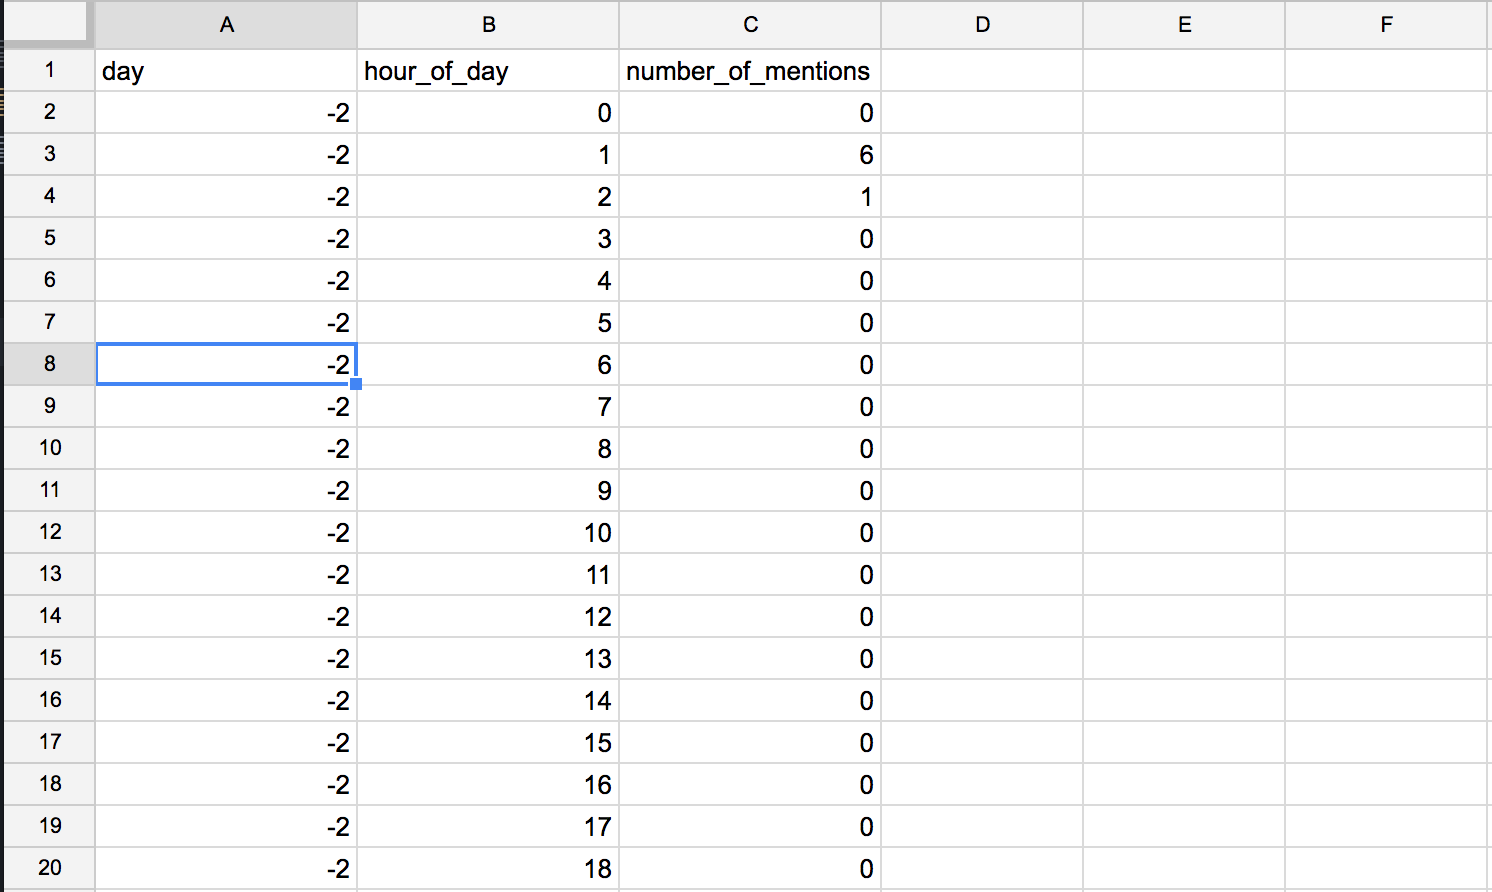
The animation and the ticker are based on three data points:
- The
dayrelative to when the trolling happened (days before or after, in full integers) - The
hour_of_daymeasured in military time (0-24) - The
number_of_mentionsat thathour_of_dayand on thatday
You can prepare your data in any software or app that allows you to work with spreadsheets, like Google Spreadsheets or Excel. Your spreadsheet should look like this. Make sure to include rows for hours and days even if there were 0 Twitter mentions during that hour on that day.
Once you have prepped it, you can copy the cells and paste them into this web tool to convert your data into a json format.
Paste the new data into the data.js file after the bit that says var data = and erase the old data.
First, you can set where on the screen you want the emitter to start by putting in numbers or ratios by changing the originX and originY values on line 32.
originX = SCREEN_WIDTH/2,
originY = SCREEN_HEIGHT/2,
You can change the color of the particles on line 36.
color = '#1da1f2';
Last but not least, make sure you update which weekday you want the ticker to display in the if clauses below. Again. It's not the cleverest code, but it does the job!
// update the day counter
if (value.day == -2 || value.day == 5){
  $('#day').html('Tuesday')
} else if (value.day == -1 || value.day == 6){
  $('#day').html('Wednesday')
} else if (value.day == 0){
  $('#day').html('Thursday')
}else if (value.day == 1){
  $('#day').html('Friday')
}	else if (value.day == 2){
  $('#day').html('Saturday')
} else if (value.day == 3){
  $('#day').html('Sunday')
}	else if (value.day == 4){
  $('#day').html('Monday')
}
If you want to preview the graphic locally, you can do so by going to your Terminal. Navigate into your directory using cd and once you're there run a local server by running this command in your terminal python -m SimpleHTTPServer. To preview the graphic go to a browser of your choice and go to localhost:8000.
MIT License Copyright 2017 BuzzFeed
Permission is hereby granted, free of charge, to any person obtaining a copy of this software and associated documentation files (the "Software"), to deal in the Software without restriction, including without limitation the rights to use, copy, modify, merge, publish, distribute, sublicense, and/or sell copies of the Software, and to permit persons to whom the Software is furnished to do so, subject to the following conditions:
The above copyright notice and this permission notice shall be included in all copies or substantial portions of the Software.
THE SOFTWARE IS PROVIDED "AS IS", WITHOUT WARRANTY OF ANY KIND, EXPRESS OR IMPLIED, INCLUDING BUT NOT LIMITED TO THE WARRANTIES OF MERCHANTABILITY, FITNESS FOR A PARTICULAR PURPOSE AND NONINFRINGEMENT. IN NO EVENT SHALL THE AUTHORS OR COPYRIGHT HOLDERS BE LIABLE FOR ANY CLAIM, DAMAGES OR OTHER LIABILITY, WHETHER IN AN ACTION OF CONTRACT, TORT OR OTHERWISE, ARISING FROM, OUT OF OR IN CONNECTION WITH THE SOFTWARE OR THE USE OR OTHER DEALINGS IN THE SOFTWARE.

