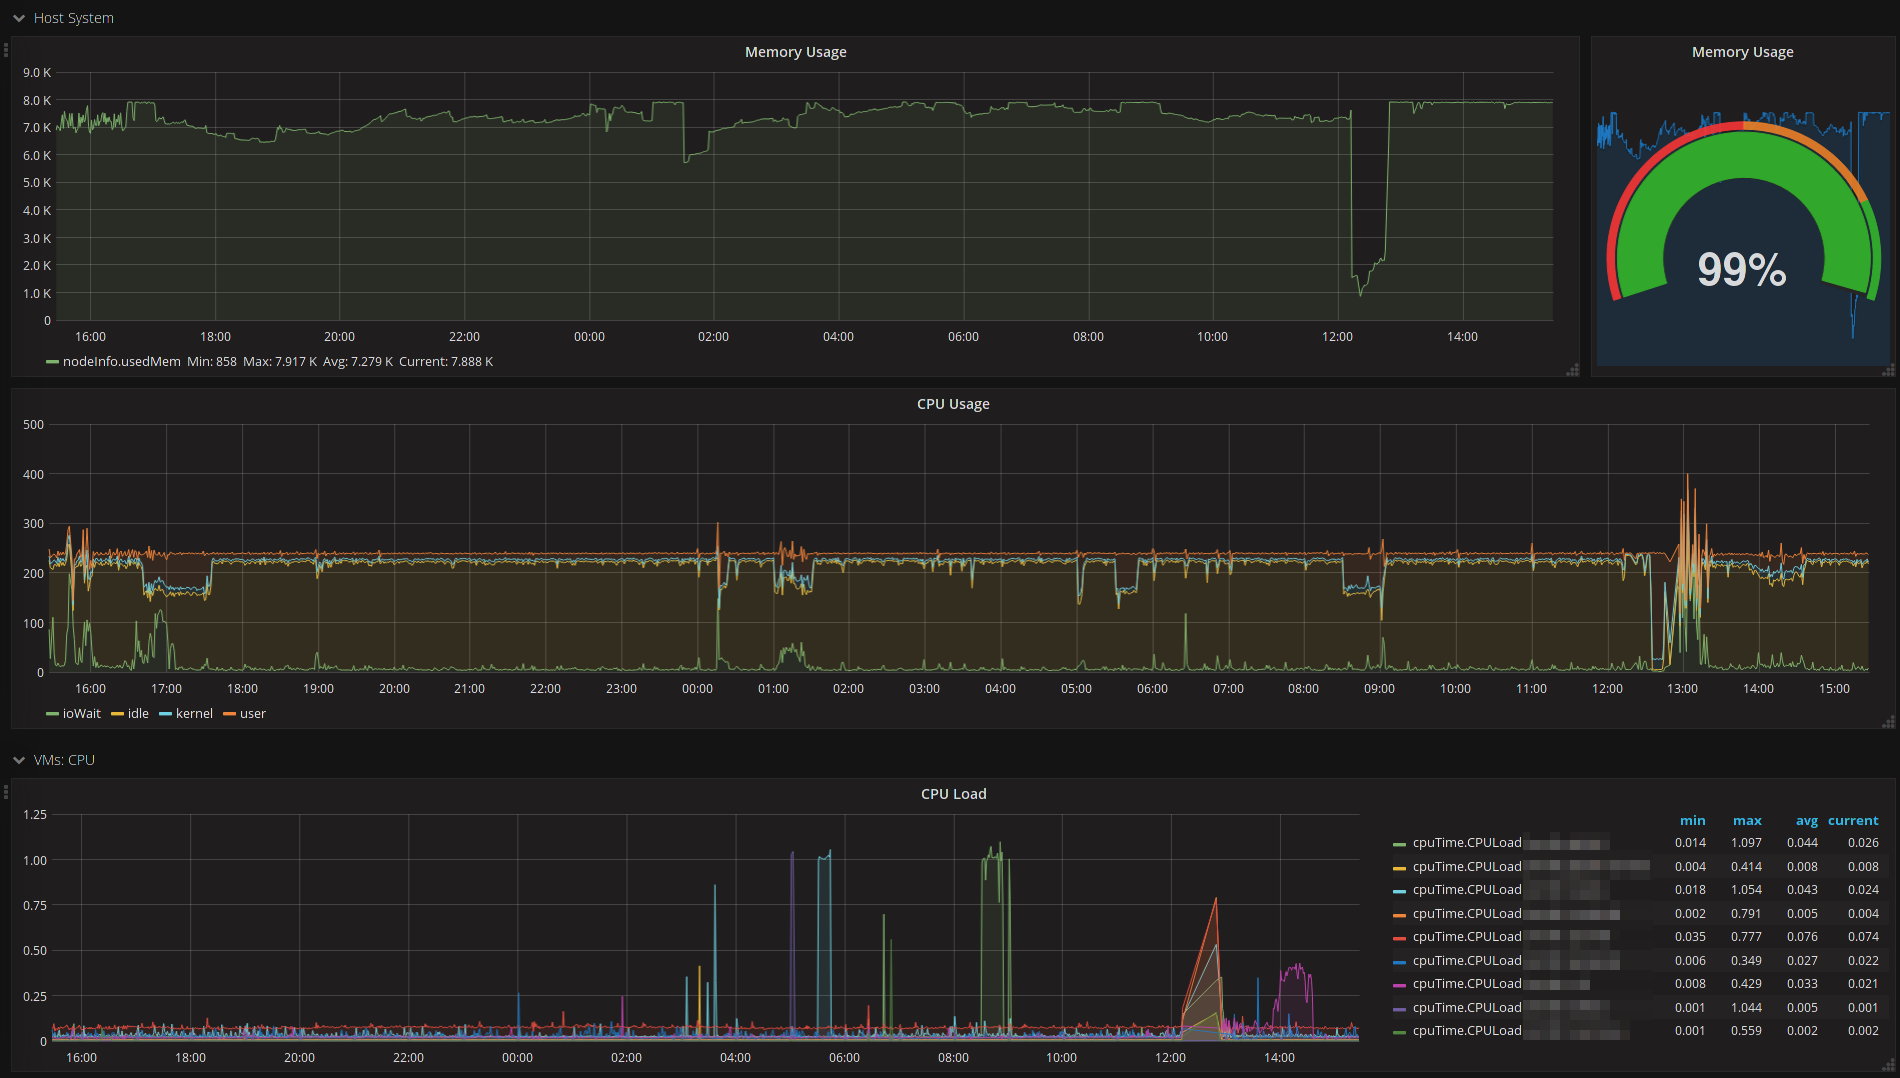
The purpose of the container is to monitor remote libvirt KVM hypervisor host and gather the information about VM resource usage. It is implemented in python2.7 with libvirt. It stores collected statistics to the remote influxdb storage.
Currently it collects next metrics:
- Host: CPU statistics, RAM statistics
- Virtual machines: cpuTime, RAM usage, disk IO, network IO
Features:
- purposed for KVM hypervisor
- tested with block devices located in files (native for Apache Cloudstack and NFS storage)
- bundled as easy to use Docker container (one container per one virtualization host)
Known to work with:
- Apache Cloudstack 4.3 with KVM hypervisor and NFS primary storage
- Apache Cloudstack 4.9 with KVM hypervisor and NFS primary storage
Usage:
# docker pull bwsw/cs-pulse-sensor
# docker run --restart=always -d --name 10.252.1.11 \
             -v /root/.ssh:/root/.ssh \
             -e PAUSE=10 \
             -e INFLUX_HOST=influx \
             -e INFLUX_PORT=8086 \
             -e INFLUX_DB=puls \
             -e INFLUX_USER=puls \
             -e INFLUX_PASSWORD=secret \
             -e GATHER_HOST_STATS=true
             -e DEBUG=true \
             -e KVM_HOST=qemu+ssh://root@10.252.1.11/system \
             bwsw/cs-pulse-sensor
Container supports next configuration parameters:
- KVM_HOST - fqdn for libvrt KVM connection line
- PAUSE - interval between metering
- INFLUX_* - information about influxdb access
- GATHER_HOST_STATS - if to collect information about a hypervisor host
- DEBUG - print or avoid JSON dumps inside docker container (useful for troubleshooting in attached mode)
Virtualization node series stored into influxdb look like:
[
    {
        "fields": {
            "freeMem": 80558,
            "idle": 120492574,
            "iowait": 39380,
            "kernel": 1198652,
            "totalMem": 128850,
            "user": 6416940
        },
        "measurement": "nodeInfo",
        "tags": {
            "vmHost": "qemu+ssh://root@10.252.1.33/system"
        }
    }
]
Virtual machine series stored into influxdb look like:
[
    {
        "fields": {
            "cpuTime": 1070.75,
            "cpus": 4
        },
        "measurement": "cpuTime",
        "tags": {
            "vmHost": "qemu+ssh://root@10.252.1.33/system",
            "vmId": "i-376-1733-VM",
            "vmUuid": "12805898-0fda-4fa6-9f18-fac64f673679"
        }
    },
    {
        "fields": {
            "maxmem": 4194304,
            "mem": 4194304,
            "rss": 1443428
        },
        "measurement": "rss",
        "tags": {
            "vmHost": "qemu+ssh://root@10.252.1.33/system",
            "vmId": "i-376-1733-VM",
            "vmUuid": "12805898-0fda-4fa6-9f18-fac64f673679"
        }
    },
    {
        "fields": {
            "readBytes": 111991494,
            "readDrops": 0,
            "readErrors": 0,
            "readPackets": 1453303,
            "writeBytes": 3067403974,
            "writeDrops": 0,
            "writeErrors": 0,
            "writePackets": 588124
        },
        "measurement": "networkInterface",
        "tags": {
            "mac": "06:f2:64:00:01:54",
            "vmHost": "qemu+ssh://root@10.252.1.33/system",
            "vmId": "i-376-1733-VM",
            "vmUuid": "12805898-0fda-4fa6-9f18-fac64f673679"
        }
    },
    {
        "fields": {
            "allocatedSpace": 890,
            "ioErrors": -1,
            "onDiskSpace": 890,
            "readBytes": 264512607744,
            "readIOPS": 16538654,
            "totalSpace": 1000,
            "writeBytes": 930057794560,
            "writeIOPS": 30476842
        },
        "measurement": "disk",
        "tags": {
            "image": "cc8121ef-2029-4f4f-826e-7c4f2c8a5563",
            "pool": "b13cb3c0-c84d-334c-9fc3-4826ae58d984",
            "vmHost": "qemu+ssh://root@10.252.1.33/system",
            "vmId": "i-376-1733-VM",
            "vmUuid": "12805898-0fda-4fa6-9f18-fac64f673679"
        }
    }
]
- import grafana_dashboard.json into your grafana
- adjust data source
Licensed under Apache 2.0 license.
