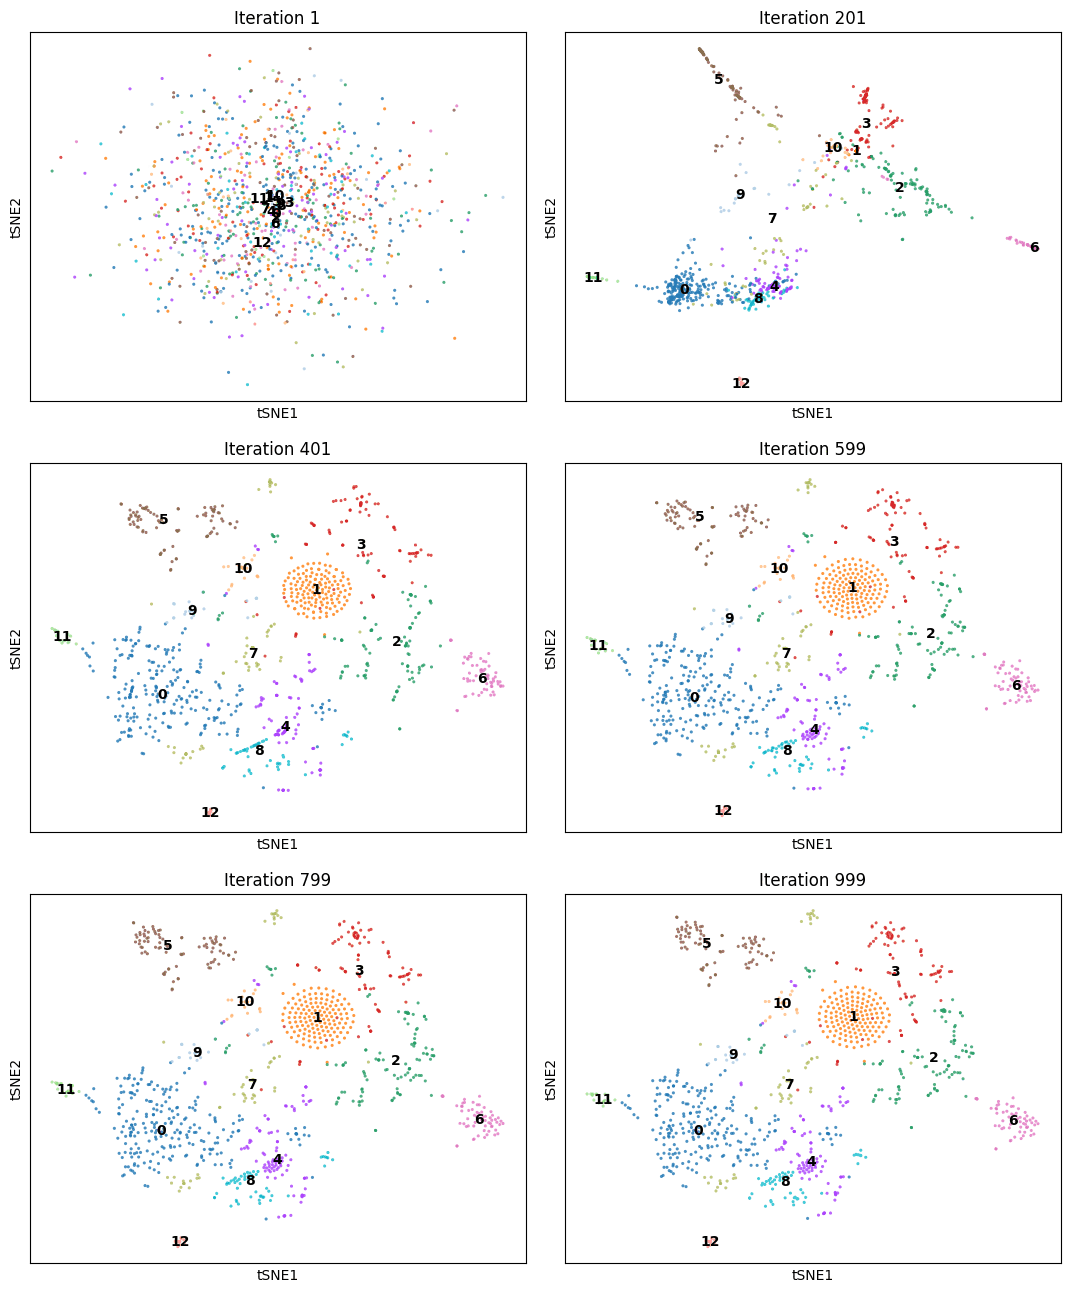
This python library that aims to act as a drop-in replacement for scanpy's t-SNE simulation functionality.
It is mainly intended for use in 10x scRNA-seq workflows, although it will theoretically work with any compatible AnnData structure.
An animation of dimenSNEon running on the 10x Genomics sample scRNA-seq data.
Installation requires the scanpy and scipy libraries to be installed (and leidenalg as well for tests). You can install these using the following command (However, setup.py should install all required dependencies for you):
pip install scanpy scipy leidenalgYou can then install the library by running:
python setup.py installIf you do not have permissions to install packages globally (you are on DataHub, for instance), add the --user flag:
python setup.py install --user(See the Testing section for information on how to test dimenSNEon)
dimenSNEon is a drop-in replacement for scanpy's t-SNE simulation functionality. You can import the library in your script by using:
import dimensneon.tsne as dtsneAnd then, once you have run PCA on your data (as you would before using scanpy's sc.tl.tsne function), you can calculate t-SNE embeddings for your data by using:
# data is our AnnData object
dtsne.tsne(data)
Then, you can plot the results using scanpy's sc.pl.tsne as you normally would.
dimenSNEon allows you to tweak aspects of the simulation by supplying optional arguments after the AnnData object. These arguments are:
perplexity(float, default =30.0): The perplexity value to target for the t-SNE simulation.iterations(int, default =1000): The number of iterations of the simulation to run.
A test notebook is provided in this repository under the tests directory, where you can test dimenSNEon on a subset of the 10x scRNA sample data from 10x genomics.
If you wish to run tests on different data, simply change DATADIR at the top of the notebook to point to another directory with scRNA-seq barcodes.tsv.gz, features.tsv.gz, and matrix.mtx.gz files.
This repository was created by Aaron Sonin.
The mathematics and mechanics behind t-SNE are from the paper "Visualizing Data using t-SNE" by Laurens van der Maaten and Geoffrey Hinton. Citation:
van der Maaten, Laurens & Hinton, Geoffrey. (2008). Viualizing data using t-SNE. Journal of Machine Learning Research. 9. 2579-2605.
Additional inspiration was drawn from sklearn and scanpy's t-SNE functionality.
Sample data is not included in the repository directly due to the size of the data. The sample data downloaded by the test notebook in this repository are as follows:
