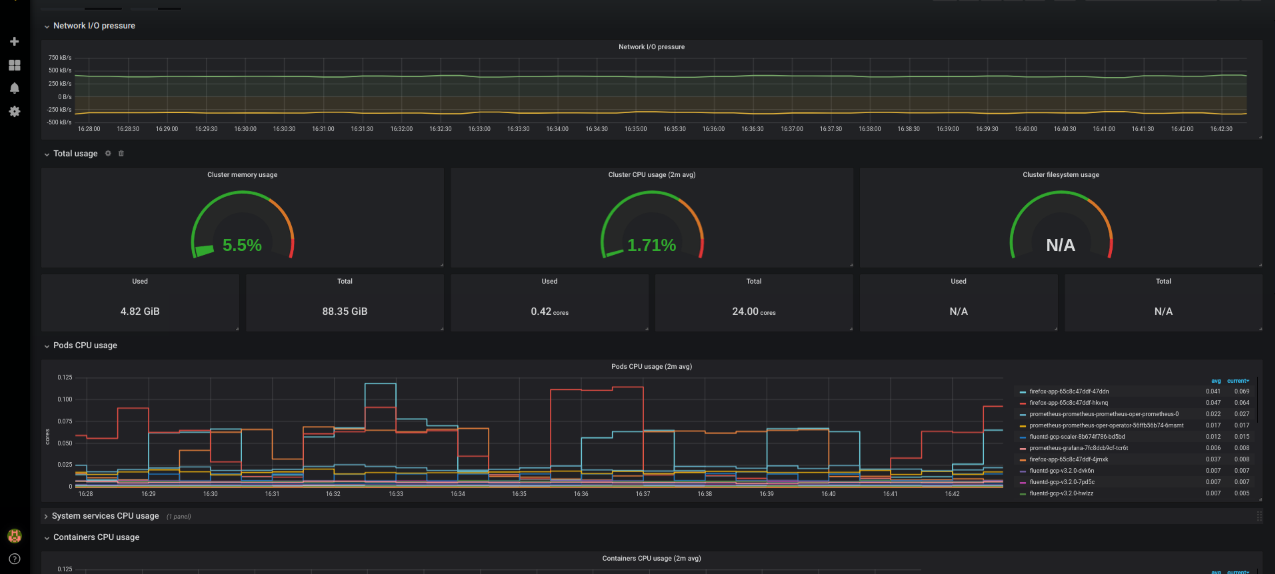
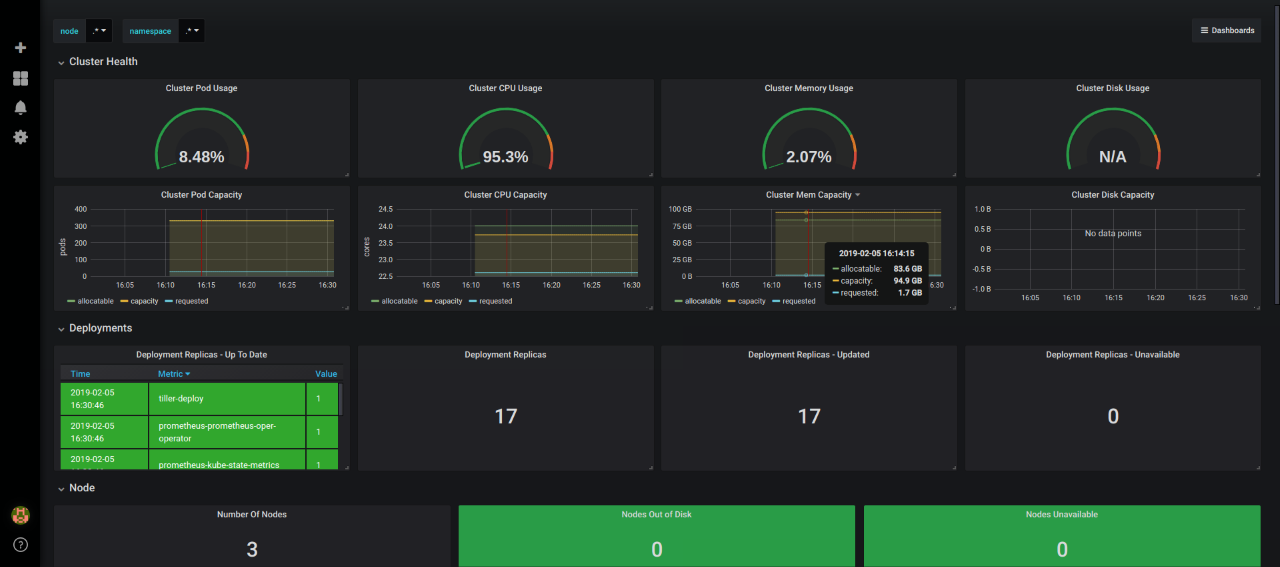
Terraform module for deploying Kubernetes Prometheus and Grafana inside a pre-existing EKS cluster.
Prometheus is an open-source systems monitoring and alerting toolkit originally built at SoundCloud. Since its inception in 2012, many companies and organizations have adopted Prometheus, and the project has a very active developer and user community. It is now a standalone open source project and maintained independently of any company. Prometheus joined the Cloud Native Computing Foundation in 2016 as the second hosted project, after Kubernetes.
Grafana is open source visualization and analytics software. It allows you to query, visualize, alert on, and explore your metrics no matter where they are stored. In plain English, it provides you with tools to turn your time-series database (TSDB) data into beautiful graphs and visualizations.
module "grafana_prometheus_monitoring" {
  source = "git::https://github.com/DNXLabs/terraform-aws-eks-grafana-prometheus.git"

  enabled = true
}
Check if Prometheus and Grafana components deployed as expected:
kubectl get all -n prometheus
kubectl get all -n grafana
In order to access the Prometheus and Grafana server URL, we are going to use the kubectl port-forward command to access the application.
# Prometheus
kubectl port-forward --address 0.0.0.0 -n prometheus deploy/prometheus-server 8001:9090
# Grafana
kubectl port-forward --address 0.0.0.0 -n grafana deploy/grafana 8001:3000When logging in, use the username and password admin.
Log in to Grafana dashboard using credentials supplied during configuration.
For creating a dashboard to monitor the cluster:
- Click "+" button on left panel and select "Import".
- Enter 3119 dashboard id under Grafana.com Dashboard.
- Click "Load".
- Enter Kubernetes Cluster Monitoring as the Dashboard name.
- Select "Prometheus" as the endpoint under prometheus data sources drop down.
- Click "Import".
This will show monitoring dashboard for all cluster nodes
For creating a dashboard to monitor all the pods:
- Click "+" button on left panel and select "Import".
- Enter 6417 dashboard id under Grafana.com Dashboard.
- Click "Load".
- Enter Kubernetes Pods Monitoring as the Dashboard name.
- Click change to set the Unique identifier (uid).
- Select "Prometheus" as the endpoint under prometheus data sources drop down.s
- Click "Import".
| Name | Version |
|---|---|
| terraform | >= 0.13 |
| aws | >= 3.13, < 4.0 |
| helm | >= 1.0, < 3.0 |
| kubernetes | >= 1.10.0, < 3.0.0 |
| Name | Version |
|---|---|
| helm | >= 1.0, < 3.0 |
| kubernetes | >= 1.10.0, < 3.0.0 |
| Name | Description | Type | Default | Required |
|---|---|---|---|---|
| create_namespace_grafana | Whether to create Grafana Kubernetes namespace with name defined by namespace. |
bool |
true |
no |
| create_namespace_prometheus | Whether to create Prometheus Kubernetes namespace with name defined by namespace. |
bool |
true |
no |
| enabled | Variable indicating whether deployment is enabled. | bool |
true |
no |
| helm_chart_grafana_name | Grafana Helm chart name to be installed | string |
"grafana" |
no |
| helm_chart_grafana_release_name | Grafana Helm release name | string |
"grafana" |
no |
| helm_chart_grafana_repo | Grafana repository name. | string |
"https://grafana.github.io/helm-charts" |
no |
| helm_chart_grafana_version | Grafana Helm chart version. | string |
"6.15.0" |
no |
| helm_chart_prometheus_name | Prometheus Helm chart name to be installed | string |
"prometheus" |
no |
| helm_chart_prometheus_release_name | Prometheus Helm release name | string |
"prometheus" |
no |
| helm_chart_prometheus_repo | Prometheus repository name. | string |
"https://prometheus-community.github.io/helm-charts" |
no |
| helm_chart_prometheus_version | Prometheus Helm chart version. | string |
"14.5.0" |
no |
| mod_dependency | Dependence variable binds all AWS resources allocated by this module, dependent modules reference this variable. | any |
null |
no |
| namespace_grafana | Kubernetes namespace to deploy Grafana stack Helm charts. | string |
"grafana" |
no |
| namespace_prometheus | Kubernetes namespace to deploy Prometheus stack Helm charts. | string |
"prometheus" |
no |
| settings_grafana | Additional settings which will be passed to Grafana Helm chart values. | map |
{ |
no |
| settings_prometheus | Additional settings which will be passed to Prometheus Helm chart values. | map |
{ |
no |
No output.
Module managed by DNX Solutions.
Apache 2 Licensed. See LICENSE for full details.


