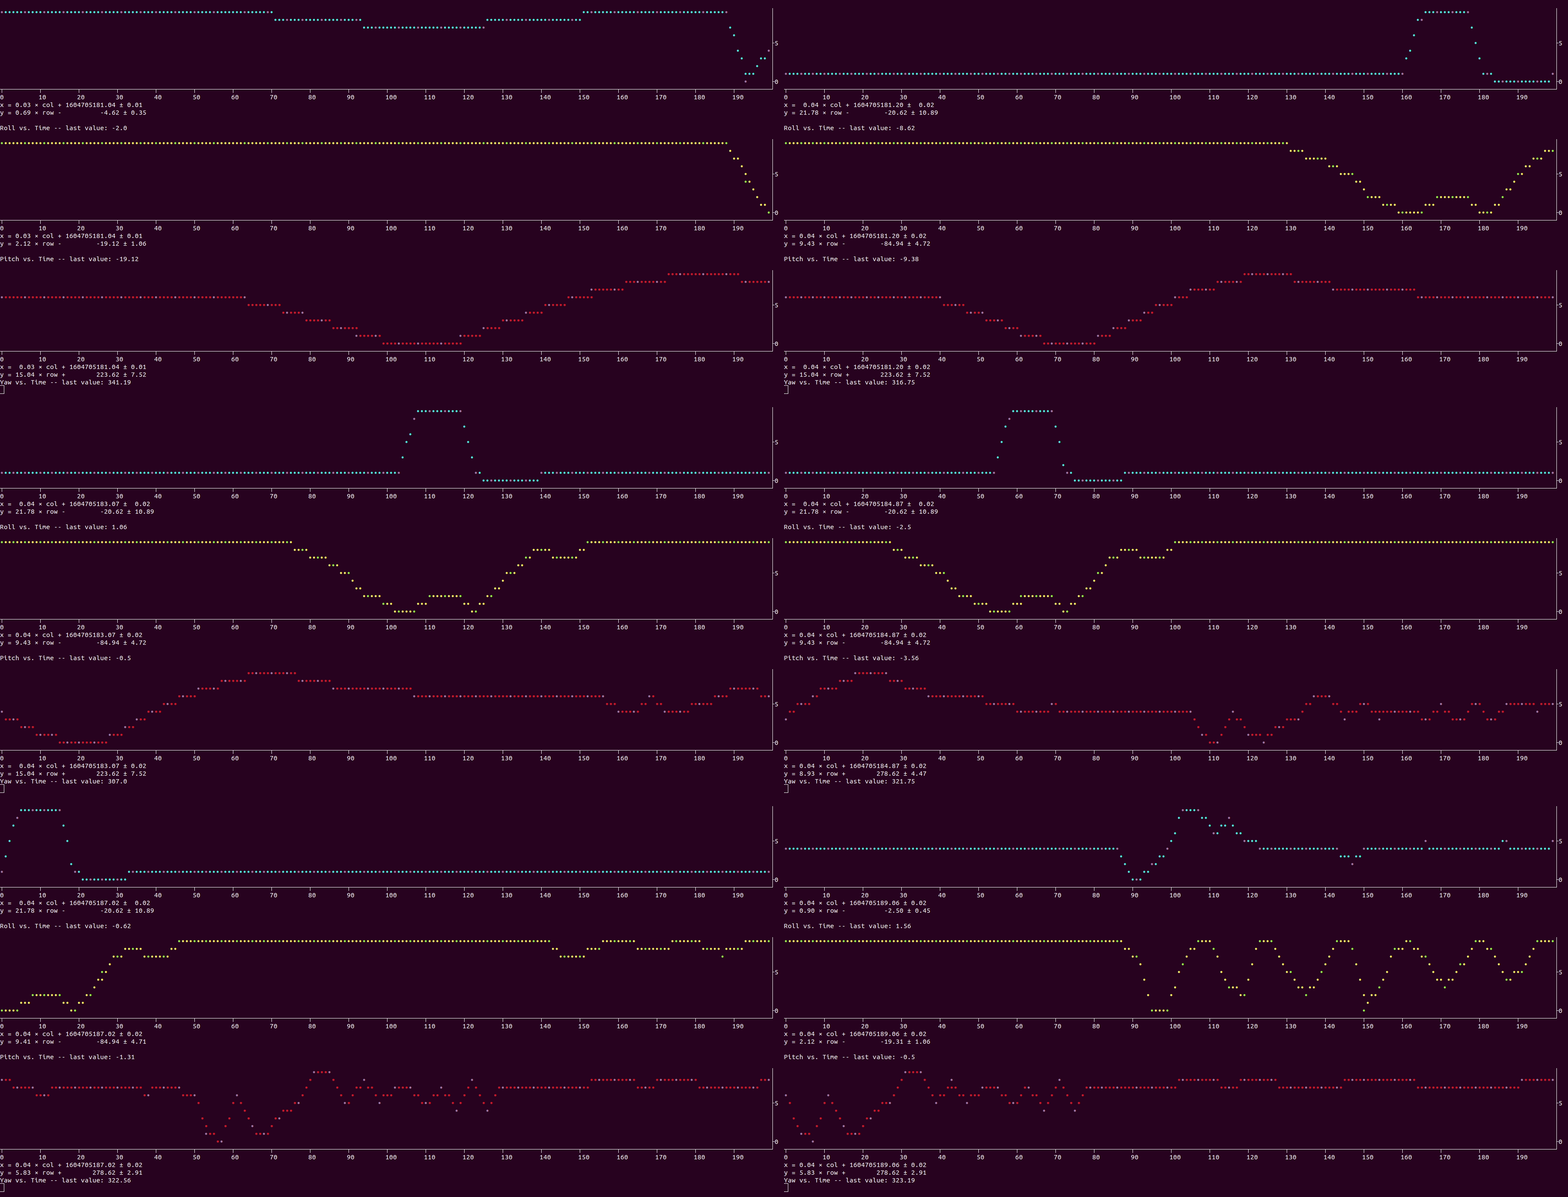
Simple modular text-based command line plotter
I recommend using a python virtualenv. Once in your environment run: pip install -r requirements.txt
This module was designed to utilize OS pipes to extract data from a source, transform that data into floating point comma separated values and pipe that to the time_series.py script. The boilerplate command is:
EXTRACT-DATA | TRANSFORM-DATA | LOAD && DISPLAY DATA
cat ./examples/example_IMU_data.txt | python src/rpy_adapter.py | python src/time_series.py

cat ./examples/example_IMU_data.txt | python src/heading_adapter.py | python src/time_series.py

cat /dev/ttyACM0 | python src/rpy_adapter.py | python src/time_series.py
To create your own adapters (seen in the examples commands as: .. | python my_adapter.py | ..) use the following boiler plate code:
import sys
import json # optional - my serial device outputs json...
# this puts stdout in unbuffered mode -- eq to python -u
import unbuffered_io

# print title(s) with $ as first char
print('$MyData vs. Time')
try:
    while True:
        # read stdin
        line = sys.stdin.readline().strip()
        # transform
        try:
            #
            #   Transform the input to comma separated float values
            #   * In this example we have 1 title meaning 1 plot
            #     the output should be one float value only
            #
            output = float(line)
        except MyKnownException:
            continue

        # print
        print(output)

except KeyboardInterrupt:
    pass
finally:
    print('\n\tExample Adapter Exiting...\n')