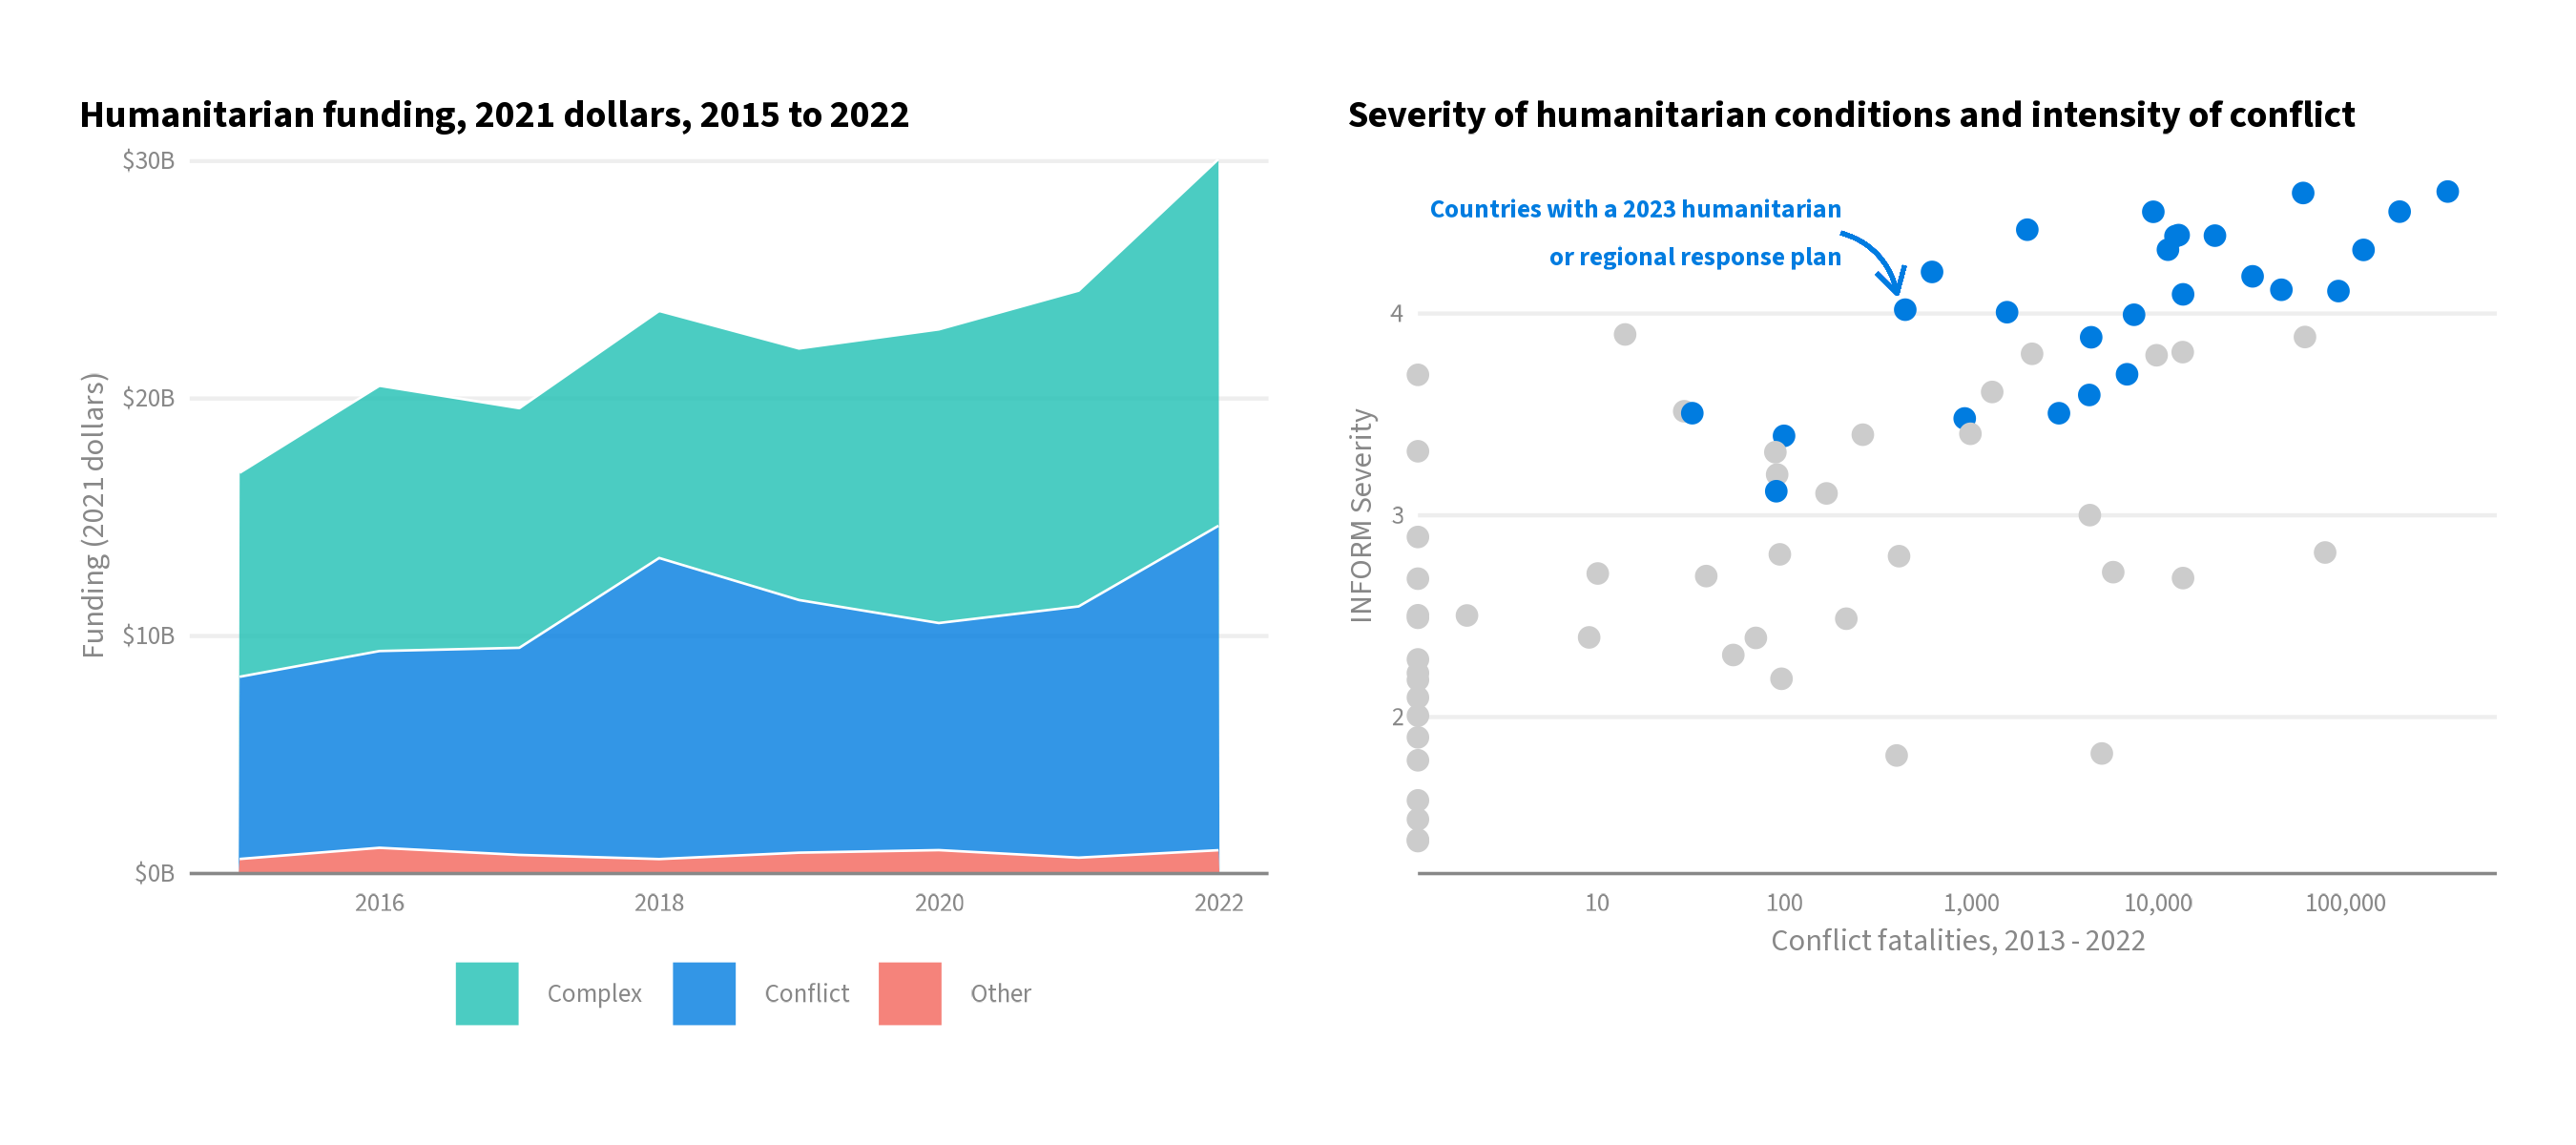
This is the codebase for generating plots used in our conflict call to action paper.
The code pulls in and wrangles data related to conflict events, humanitarian
severity of humanitarian conditions, and humanitarian funding flows and response
locations in 01_data_wrangling.R. The wrangled data is stored in data/.
This wrangled data is then plotted in 02_plotting.R, with the primary plot
stored in plots/, and an archive of previous plots in plots/archive.
The data used in the plot is described below. All datasets used in the final plot are pulled in programmatically in the codebase. These are:
-
UN OCHA Financial Tracking Services data. The FTS tracks reported to funding to humanitarian crises globally. For the analysis, data on required funding (the full appeal for funds) and actual funding provided is aggregated up across all countries from 1989 to 2023.
-
UCDP Dataset Download Center. Data on conflict events managed by the UCDP/PRIO Armed Conflict research program is used for measuring conflict. Data is a set of geo-referenced events across time with a range of other metadata.
-
INFORM Severity Index. The severity of humanitarian crises is measured by the INFORM Severity Index. The data includes sub-measures of displacement severity and a list of key drivers of severity that is also used to contextualize the crises.
During the exploration, a number of manually loaded datasets were used, as well as
additional dataset accessed via API. These were stored locally in the repository
under input/.
-
geoBoundaries-AFG-ADM1_simplified.geojson: 1st-level administrative boundaries for Afghanistan, since the official country boundaries used by the UN are not publicly available. Sourced from HDX. -
afg_pcode_map.csv: Manually created map between theshapeIDcolumn of the Afghanistan shapefile and the PCODEs used by the UN. -
2022_sectoral_pins.csv: Data on people in need in 2022 as estimated by UN OCHA. The file is more granular and detailed than publicly available, and thus cannot be shared publicly. The data for each country individually can be sourced individually from HDX. -
UN World Population Prospects. The UN WPP population estimates for 2022 were used to generate percent of populations in need at the country-level in 2022.
A number of other plots were explored,
stored in plots/archive.
-
funding_real.png: Humanitarian funding (actually provided for response) is compared across time for crises that are driven entirely by conflict, complex crises driven by conflict and other factors, and other crises driven by any factors other than conflict. -
requirements_real.png: The above plot, but using required (the appealed for funding) instead of actual funding, since political considerations bias the provision of humanitarian funding. However, results appear generally the same across both plots. -
funding_pct.png: The above plot, but looking at the proportion of yearly funding going to each conflict type, showing the consistent funding of conflict and complex crises taking up nearly all humanitarian funding. -
requirements_pct.png: As above, using requirements to avoid potential bias, although visualizations remain similar. -
inform_map.png: Map of countries showing their INFORM Severity index in January 2022, with an overlay of all UCDP conflict incidents in 2021. Shows the quite clear relationship between humanitarian conditions and conflict incidents. -
inform_conf_disp.png: Scatter plot showing the relationship between a country's humanitarian severity and the # of conflict events in that country, with the severity of a country's displacement crisis coloring the points to highlight that high severity countries with limited conflict are often impacted by conflict from other locations. -
pin_adm1.png: Scatter plot showing the relationship between conflict and % of population in need, measured at the 1st level administrative boundaries across 14 countries. -
pin_iso3.png: Scatter plot showing the relationship between conflict and % of population in need, measured at the country level across 19 countries.
The renv project environment manager for R is used for package dependencies and reproducibility. When the project is opened in RStudio, renv should automatically install itself. To match your project environment to what was used for the analysis, simply run:
renv::restore()Refer to the renv documentation for more details.
The only non-publicly available data is on People in Need (PiN) from OCHA. This file will likely not be shared even upon request due to its sensitivity, but the analysis can be reroduced with your own PiN data file as long as long as it has PiN data for countries with population data and PCODEs for subnational data that can be matched to OCHA's Common Operational Datasets.
