We extracted Twitter data from the public Coronavirus Twitter dataset created by Chen, Lerman and Ferrara (2020). The dataset features tweets containing keywords related to the COVID-19 pandemics collected from the Twitter streaming API from 28th January 2020 and is continued to be updated every week. By the time we collected our data (July 2020), it contained more than 232 million tweets and over 60% of tweets are in English. The present project seeks to analyse COVID-19 conspiracy theory (CT) related tweets made by Twitter users from Jan 21 to June 30, 2020.
According to a pre-identified keyword list, we firstly filtered CT related tweets by self-defined regular expressions (please refer to ct_keywords.txt file for more information). After some preliminary data wranglings (i.e., removing NAs, removing non-English tweets, etc.), we kept sample tweets with following information: tweet user id, tweet user screen name, tweet user name, tweet id, tweet created time stamp, retweeted tweet id, retweeted user id, retweet created time stamp, reply user id, reply tweet id, quoted status, mentioned user id, url, source, favourite count, retweet count, language code, contents, etc. As a result, 171,132 tweets (ct_twitter_1016.rds file in this repo) were retrieved finally. Details are shown as below.
| CT ID | CT category | Num of Cases |
|---|---|---|
| CT 1 | 5G | 115,161 |
| CT 2 | Bill Gates | 907 |
| CT 3 | Bioweapon | 9,196 |
| CT 4 | Lab Leakage | 431 |
| CT 5 | Man-made virus | 114 |
| CT 6 | Deaths | 151 |
| CT 7 | China travel (abandon) | 0 |
| CT 8 | China coverup | 634 |
| CT 9 | China cellphone death | 79 |
| CT 10 | China kills patients | 161 |
| CT 11 | China mass cremation | 5 |
| CT 12 | COVID-19 against Trump | 155 |
| CT 13 | Exaggerated threat | 158 |
| CT 14 | Republicans downplay threats | 11 |
| CT 15 | States falsify testing data | 145 |
| CT 16 | Fauci | 503 |
| CT 17 | Flu compairison | 18,465 |
| CT 18 | George Soros funded lab | 62 |
| CT 19 | COVID-19 hoax | 23,876 |
| CT 20 | Hospital payoffs | 306 |
| CT 21 | Trump hydroxychloroquine | 20 |
| CT 22 | obama wuhan lab | 444 |
| CT 23 | plandemic judy | 66 |
| CT 24 | Sam Hyde | 25 |
| CT 25 | Trump owns testkits | 0 |
| CT 26 | Trump siliences Messonnier | 17 |
| CT 27 | Trump withholds testkits | 1 |
| CT 28 | cattle and canine vaccines | 39 |
We first created an all-user-id list to capture all users’ ids including tweet users, retweet users and reply users (N = 197,117). Secondly, based on this all-user-id list, we apply Twitter advance research to fetch their user profiles via Twitter API and 179,350 users’ profile were successfully achieved. There are several reasons for the lost 17,767 users in this step. Above all, they might be removed or suspended by Twitter by the time we retrieved because of their violation of Twitter’s policies or bots’ behaviours; or they might be deleted by the user himself/herself. Among those fetched user profiles, 1749 users were protected, meaning that we would not be able to estimate their political ideology as well. As a result, 177,601 users were eligible to be analysed in the next level.
Thirdly, we applied R package tweetscores to estimate each user’s political ideology. It is an algorithm developed by Barberá (2015), assuming that people are more likely to follow social media accounts of elected officials who align with their ideology. In other words, it would estimate a user’s political ideology based on his/her followees. It yielded a continuous ideological score from -2.5 to +2.5 with a mean of 0 for each user (negative and positive scores mean Democrats and Republicans respectively). With the user profile data, we then extracted all users’ followees (N = 380,467,763) and calculated their political ideology accordingly. 164,941 users are successfully fetched with ideology scores while 37,193 users’ ideologies are NA (they did not follow any political related Twitter accounts). Therefore, we recoded those NAs into 0 score as well, indicating that these users might be indifferent to political affairs or have neutral political ideologies.
Please refer to ideos.rds file for details and this data file is the meta file for political ideology related analysis in the project.
To detect the diffusion model of CT tweets, we first re-constructed retweet chains. Twitter API only records retweet chains of the source tweet and last retweet, ignoring intermediareis. For example, if A is the source tweet, B retweets A, and then C retweets it from B, Twitter API would only record two chains: B-A, C-A, neglecting the real chain C-B. In other words, all indirect retweets are directly related to the source tweet in raw Twitter data. In addition, the retweet count variable in raw Twitter data only represent the retweet count of source tweets. Please refer to details of retweeting information here and raw Twitter data metircs here.
The overall logic for rebuilding retweet chains is that, for a source tweet and all its retweets, we first sort retweets in a chronological order, and then judge whether the retweet’s user is a follower of the source tweet user or other retweet users’ follower. The retweet chain would be re-constructed on the most recent retweeting behaviour between two users with a following relationship. For more details, please refer to Liang's paper Broadcast Versus Viral Spreading: The Structure of Diffusion Cascades and Selective Sharing on Social Media.
For retweets in our CT dataset, they might not have completed retweets of every source retweet. For example, source tweet A’s retweet count indicates that it was retweeted 10 times, however, there might be only 5 retweets collected in our dataset. The retweet chain then is constructed based on these retweets. Several reasons should be responsible for this limitation. First of all, it is the sampling error of the public Coronavirus Twitter dataset due to its data collection methods. Secondly, the retweet user might delete their retweets before our data collection. Moreover, the retweet user has a protected Twitter account so that we cannot access their data.
To make up for it, we re-collected additional 3,929 original tweets’ retweets (N=45,516) via Twitter API whose retweet counts are less than 100 (the Twitter API limits developers’ requesting behaviours of retrieving retweets from a certain tweet with a maximum quota of 100.) Hence, the reconstruction was built on two datasets: 1) retweets in our raw CT dataset; 2) original tweets in our CT dataset and their retweets from another round of Twitter API data collection. Please refer to diffNet_1007.rds for reconstructed retweet chains. Following research related to retweet behaviors is based on this data file.
Next, we calculatd virality scores of tweets based on the reconstructed retweet chains. You can refer to virality_score_aug18.rds for this variable data.
We applied dictionary-based method to construct moral-emotional variables. For each tweet content, we cleaned noise first including urls, retweet prefix, special characters etc. Then we counted moral-emotional words in tweets via quanteda package. Moral and emotional dictionaries comes from following sources:
- Moral Dictionaries:
- Graham, J., Haidt, J., & Nosek, B. A. (2009). Liberals and Conservatives Rely on Different Sets of Moral Foundations, Appendix & Moral Foundation Org
- Gantman, A. P., & Van Bavel, J. J. (2014). The moral pop-out effect: Enhanced perceptual awareness of morally relevant stimuli. Appendix
- Brady, W. J., Wills, J. A., Jost, J. T., Tucker, J. A., & Van Bavel, J. J. (2017). Moral Contagion: How Emotion Shapes Diffusion of Moral Content in Social Networks. Appdendix
- Emotion Dictionaries:
- Linguistic Inquiry and Word Count LIWC 2015 dictionary
- Brady, W. J., Wills, J. A., Jost, J. T., Tucker, J. A., & Van Bavel, J. J. (2017). Moral Contagion: How Emotion Shapes Diffusion of Moral Content in Social Networks. Appdendix
The dictionary file was saved as the moral-emo.rds and this process can be replicated via tokens_lookup() function.
For Beliefs and RIAS variables, we applied machine learning methods to construct. We first manually coded a sample of tweets (N=3,000), (see details in code_sample1009.rds file), which served as our labelled dataset for model training. Tweets were coded into two variables: (1) opinion (non-opinioned, affirm, deny); (2) rumor types (refutation, belief, disbelief, guide, sarcastic, providing information, interrogatory, prudent, sense-making, emotional, rhetorical question, authenticating, reports, others). To achieve better prediction result, I split the task into binary classification for each item. model training was completed with caret package in R.
For each item, I tested 5 mainstream algorithms (Lasso, SVM, KNN, naive bayes, random forest) and selected the best one. Generally, random forest out-performed other algorithms in our classification task. Therefore, I used random forest to train our models.
It should be noted that, human coders found that among our current raw CT tweet dataset, there are still many tweets unrelated to conspiracy theories, indicating the limiation of keywords filters in our data collection procedure. We first trained a model to further filter raw CT tweet dataset and our rest variables were train among those labelled "related" CT tweets (N=2,235).
The model training information for each variable is listed as below.
| variable | binary focus | accuracy | recall | precision | F1 score |
|---|---|---|---|---|---|
| related | related | 0.83 | 0.98 | 0.82 | 0.89 |
| affirm | Not | 0.79 | 0.94 | 0.79 | 0.86 |
| deny | Not | 0.78 | 0.94 | 0.80 | 0.86 |
| N/O | Not | 0.80 | 0.96 | 0.75 (0.93) | 0.85 |
| belief | Not | 0.83 | 0.89(0.31) | 0.91(0.26) | 0.90(0.28) |
| disbelief | Not | 0.80 | 0.86(0.39) | 0.91(0.29) | 0.88(0.33) |
| refutation | Not | 0.89 | 0.91(0.32) | 0.97(0.14) | 0.94(0.19) |
| providing info | Not | 0.78 | 0.79(0.74) | 0.94(0.42) | 0.85(0.54) |
| sense making | Not | 0.86 | 0.87(0.18) | 0.97(0.04) | 0.92(0.06) |
| reports | Not | 0.87 | 0.90(0.66) | 0.95(0.47) | 0.92(0.55) |
| rhetorical question | Not | 0.94 | 0.95(0.17) | 0.99(0.05)) | 0.97(0.07) |
| sarcastic | Not | 0.92 | 0.95(0.24) | 0.96(0.20) | 0.96(0.22) |
| others(AUTH/INT/G/PRU) | Not | 0.92 | 0.94(0.13) | 0.97(0.08) | 0.96(0.10) |
| uncodeable | Not | 0.80 | 0.84(0.24) | 0.95(0.08) | 0.89(0.12) |
| UC-T | Not | 0.90 | 0.94(0.81) | 0.93(0.84) | 0.93(0.82) |
With these models, values for stance and type were saved in ml_tweet_3.rds file. It should be noted that for the type variable, models performed very differently for binary elements because there are not enough training samples for model construction.
After data wrangling, we finally constructed two dataframes for running regressions: ct_original.rds and ct_retweet.rds.
However, given the limitation of machine learning, the classification results might not be as well as we expected. Therefore, I also reported the result of RQs with human-coded variables only in the next section, serving as a reference for evaluating the performance of machine generated variables. Ideally, results from the two datasets should be similar. But if the whole dataset performs worse than the human-coded only dataset, it is very likely that our machine learning algorithms are not good enough.
With provided human coding samples, we are already capable of answering some RQs in the proposal though with limited tweets. Following results are based on the human-coded variables and therefore it is more reliable on the current stage.
Generally, there are more conservatives express and share CT related tweets than liberals. In addition, conservatives are more likely to express and share beliefs in CT related tweets as well. (A = affirmative, D = denied, N/O = non-opinioned)
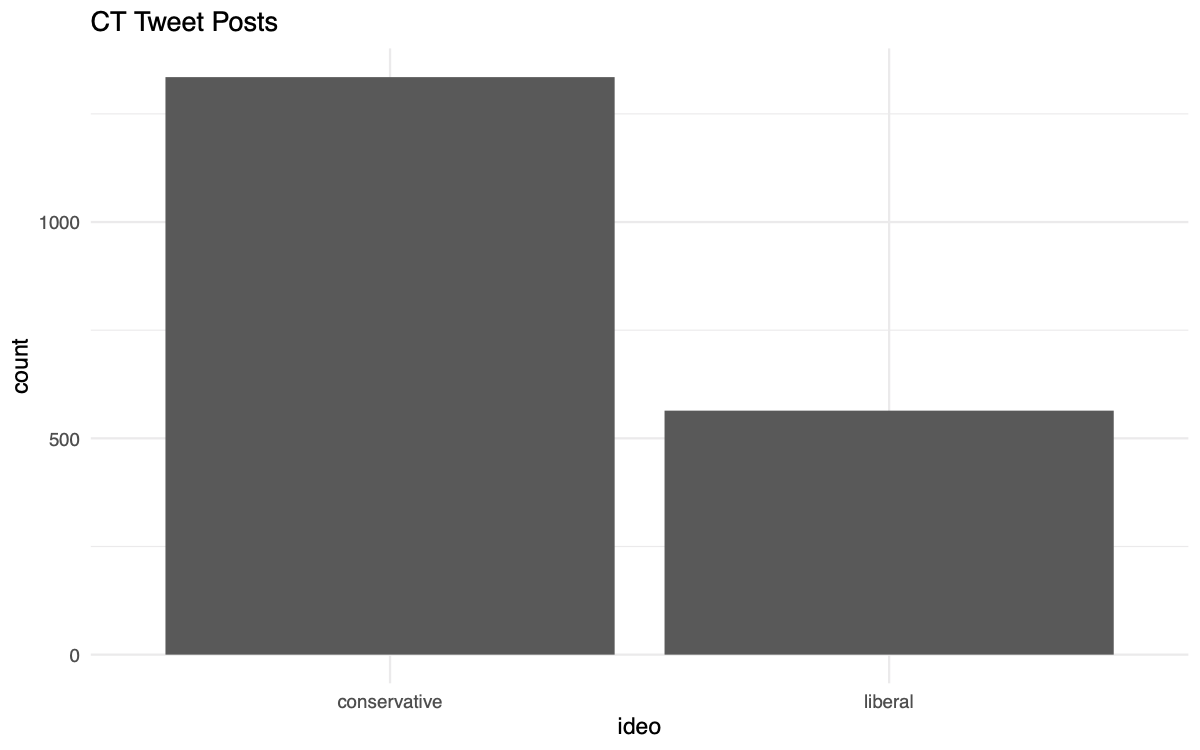
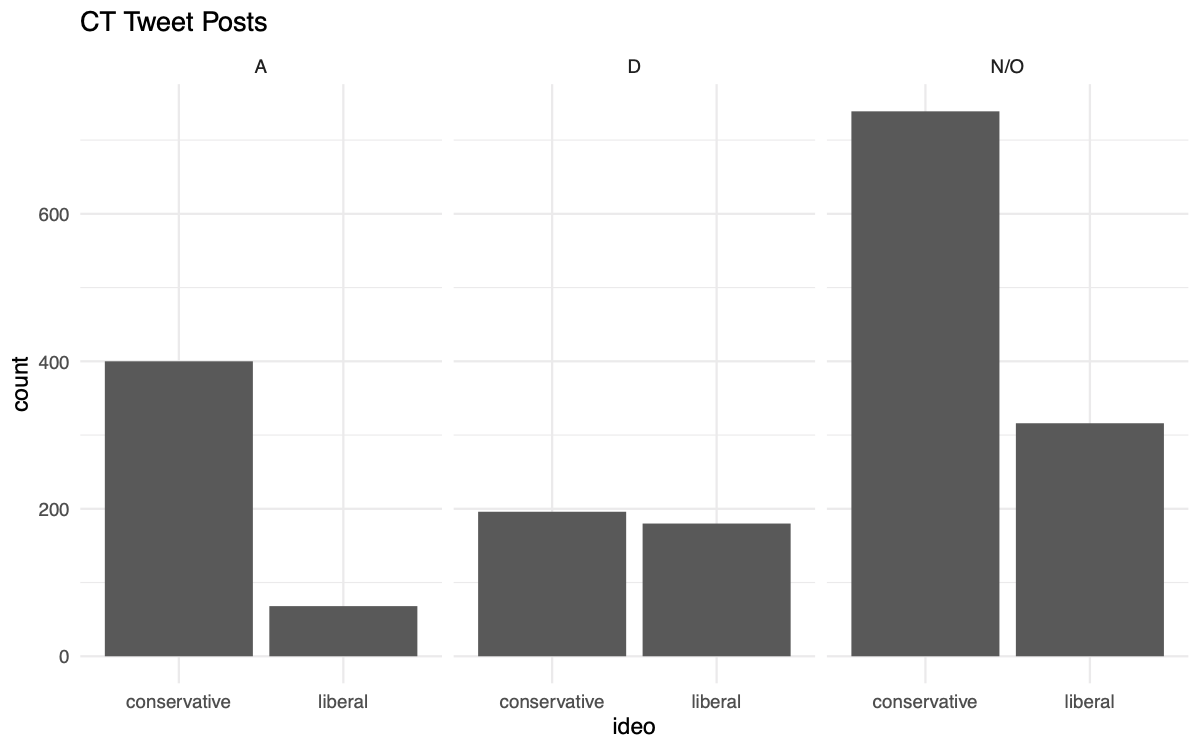
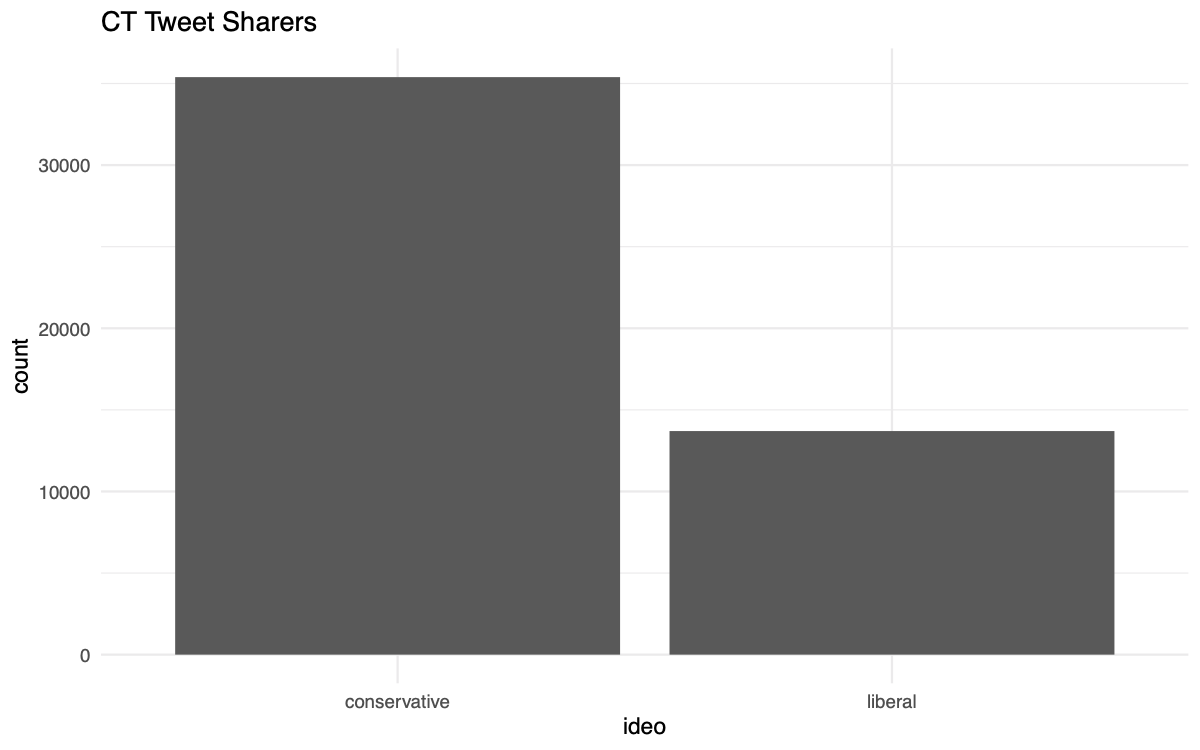
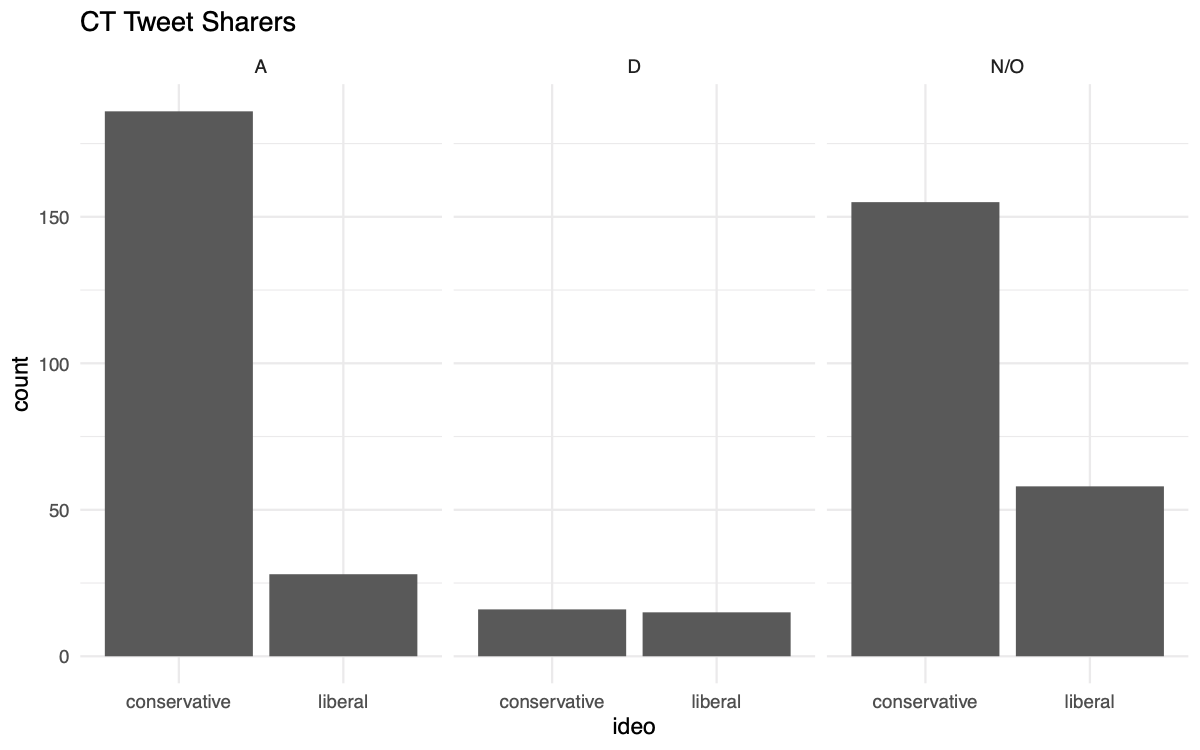
To be brief, conservatives would produce more CT tweets than liberals, except for sarcastic ones. As for disbelief and refutation types of content, conservatives and liberals' tweet counts are close.
| Name | Type | Conservative | Liberal | ratio C/L |
|---|---|---|---|---|
| AUTH | authenticating | 19 | 0 | ~ |
| B | belife | 125 | 26 | 4.81 |
| Dis | disbelief | 86 | 81 | 1.06 |
| G | guide | 3 | 1 | 3 |
| INT | interrogatory | 19 | 0 | ~ |
| PI | providing information | 241 | 30 | 8.03 |
| PRU | prudent | 3 | 0 | ~ |
| R | refutation | 58 | 33 | 1.76 |
| REP | reports | 111 | 49 | 2.67 |
| RQ | rhetorical question | 12 | 4 | 3 |
| S | Sarcastic | 20 | 47 | 0.43 |
| SM | sense making | 39 | 13 | 3 |
RQ 3: How do emotions, moral sentiments shape diffusion of COVID-19 CTs within and between political clusters?
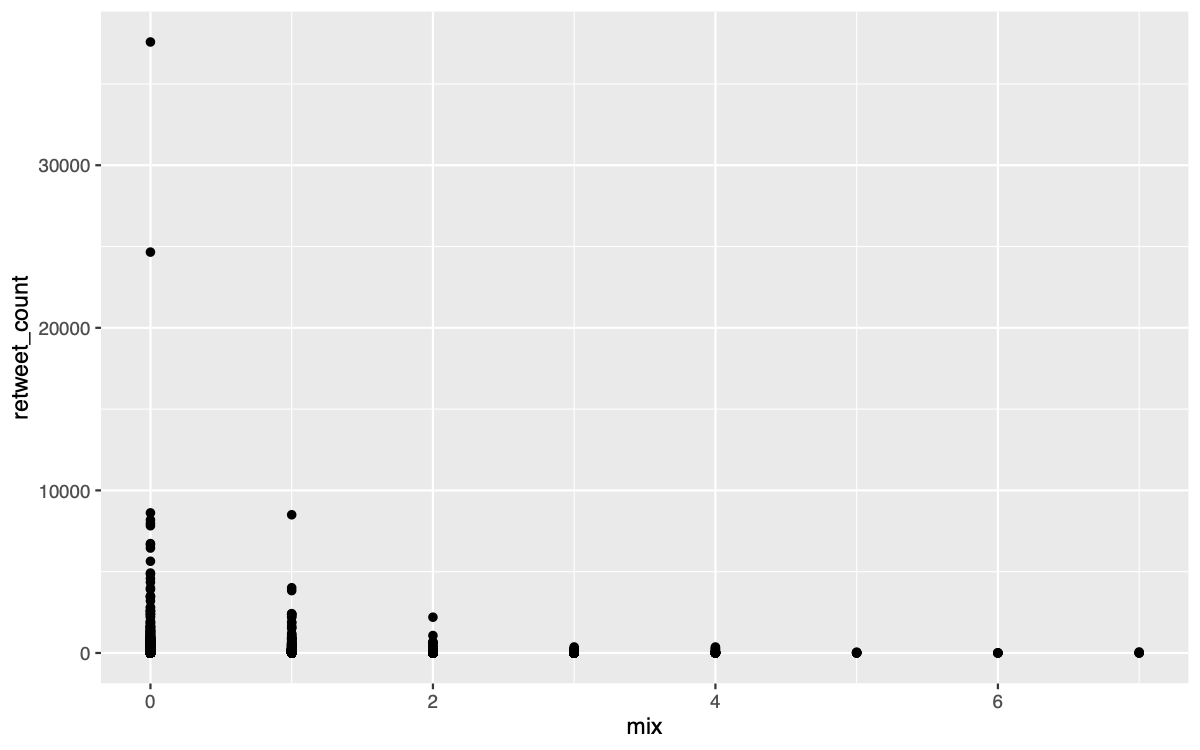
First of all, there is no significant correlation between the number of moral-emotional words (mix as the x axle) and retweet counts (retweet count as the y axle). It should be noted that the distribution of retweet count is much sparser than the number of moral-emotional words, where data could be further manipulated.
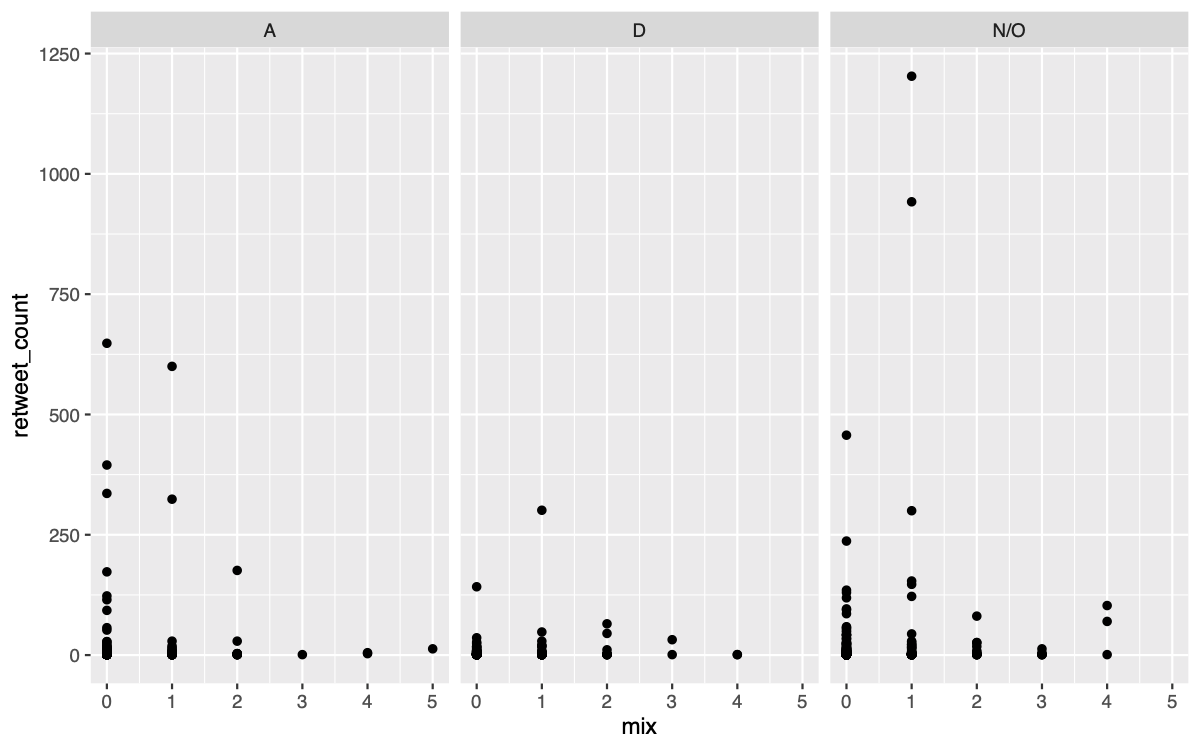
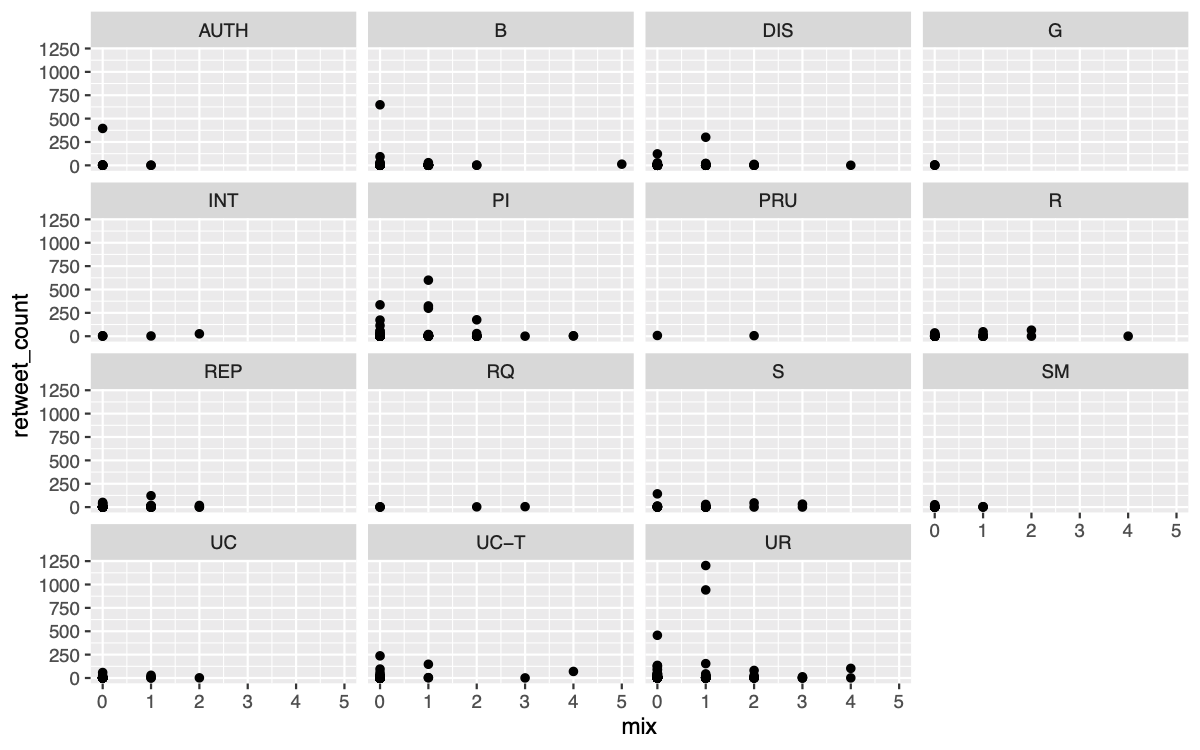
Similar result when taking Stance and Type variable into consideration.
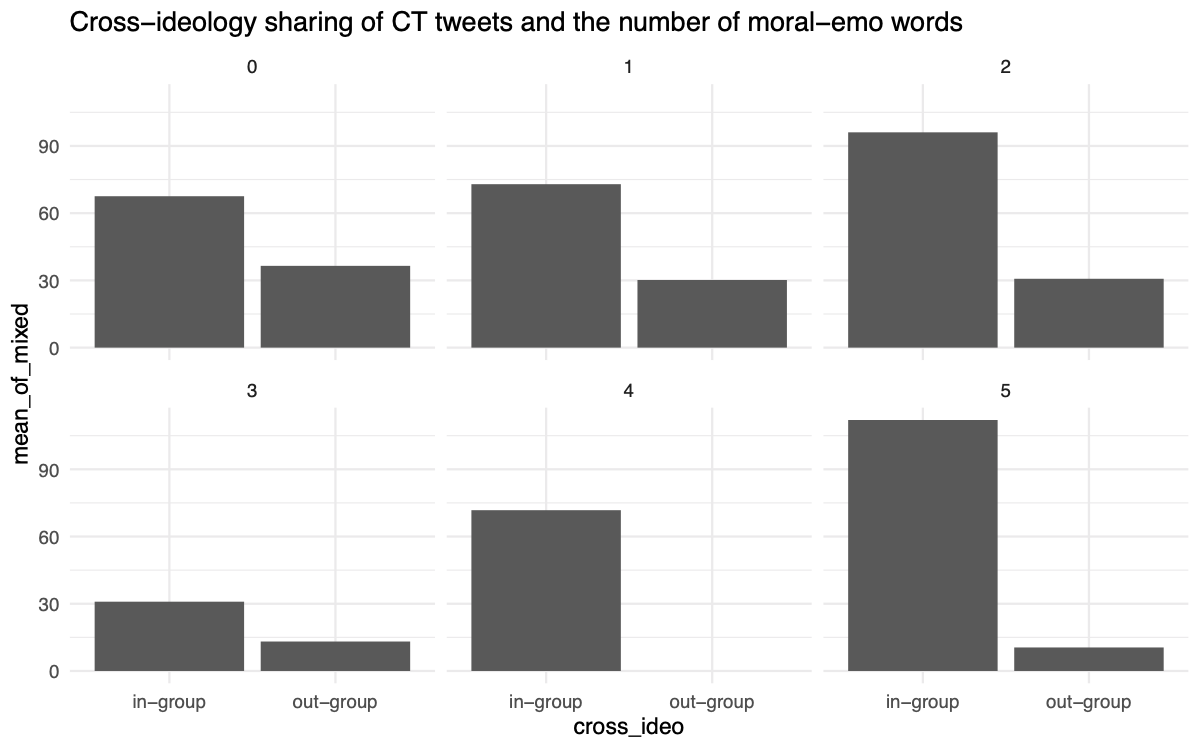
Among all levels of moral-emotional words, sharing behaviors of CT tweets are more likely to happen within the same political clusters. The below graphs represents the number of shares of CT tweets with different moral emotional words. For example, the sixth one with lable 5 means that among CT tweets containing 5 moral emotional words, in-group users (same ideology)(N=112) retweet 10.67 times more than out-group users (N=10.5) on average.
| Num of moral-emo words | in-group | out-group | Ratio I/O |
|---|---|---|---|
| 0 | 67.6 | 36.5 | 1.85 |
| 1 | 72.9 | 30.2 | 2.41 |
| 2 | 96.1 | 30.7 | 3.13 |
| 3 | 30.9 | 13.1 | 2.36 |
| 4 | 71.8 | 0 | ~ |
| 5 | 112 | 10.5 | 10.67 |
Higher virality score (VS) suggests a viral model while lower virality score suggests a broadcasting model. We adopted a normalized virality score and the range is from 0 to 1. As showing in the below chart, our limited data demonstrate that tweets expressing disbeliefs among both political clusters follow a broadcast model (VS = 0). In addtiional, compared to disbeliefs, tweets expressing beliefs follow a more viral model (VS = 0.13).
| type | conservative avg VS | liberal avg VS |
|---|---|---|
| B | 0.13 | NA |
| DIS | 0.00 | 0.00 |
| PI | 0.165 | 0.063 |
| PRU | 0.286 | NA |
| R | 0.00 | 0.00 |
| REP | 0.00 | 0.15 |
| S | 0.054 | NA |
