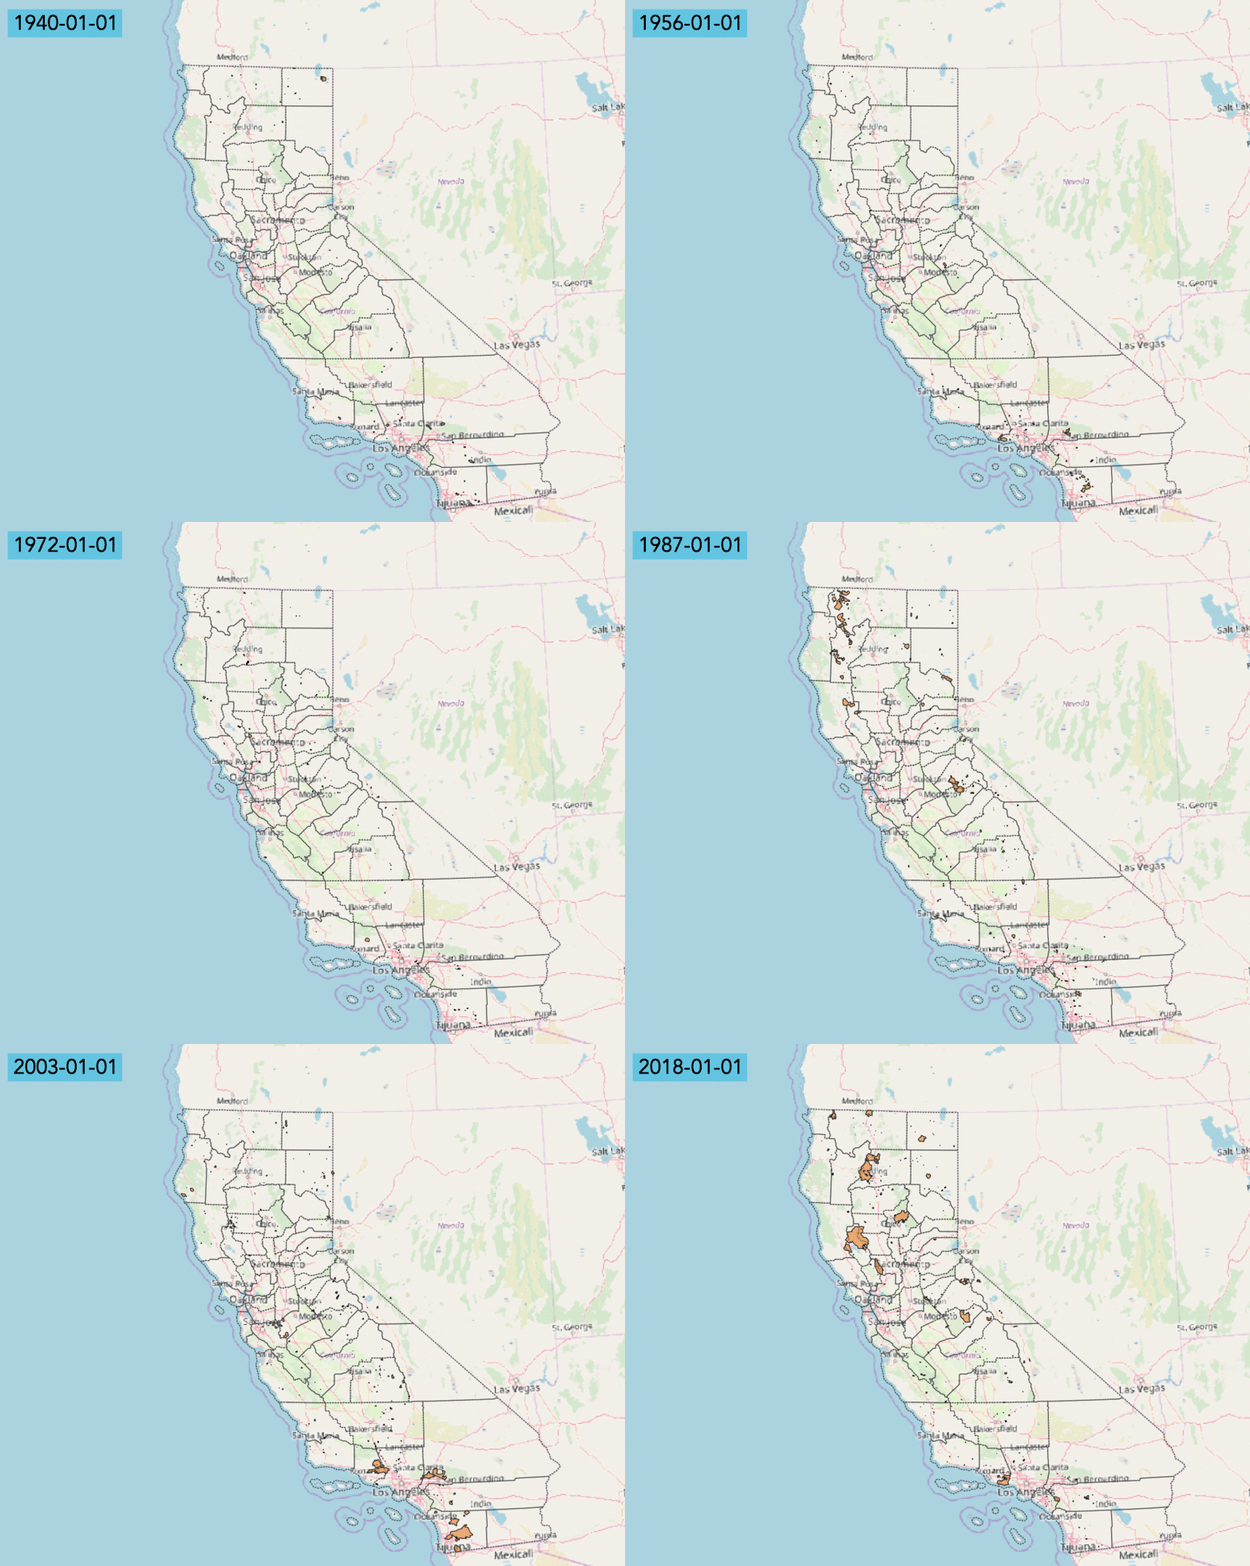
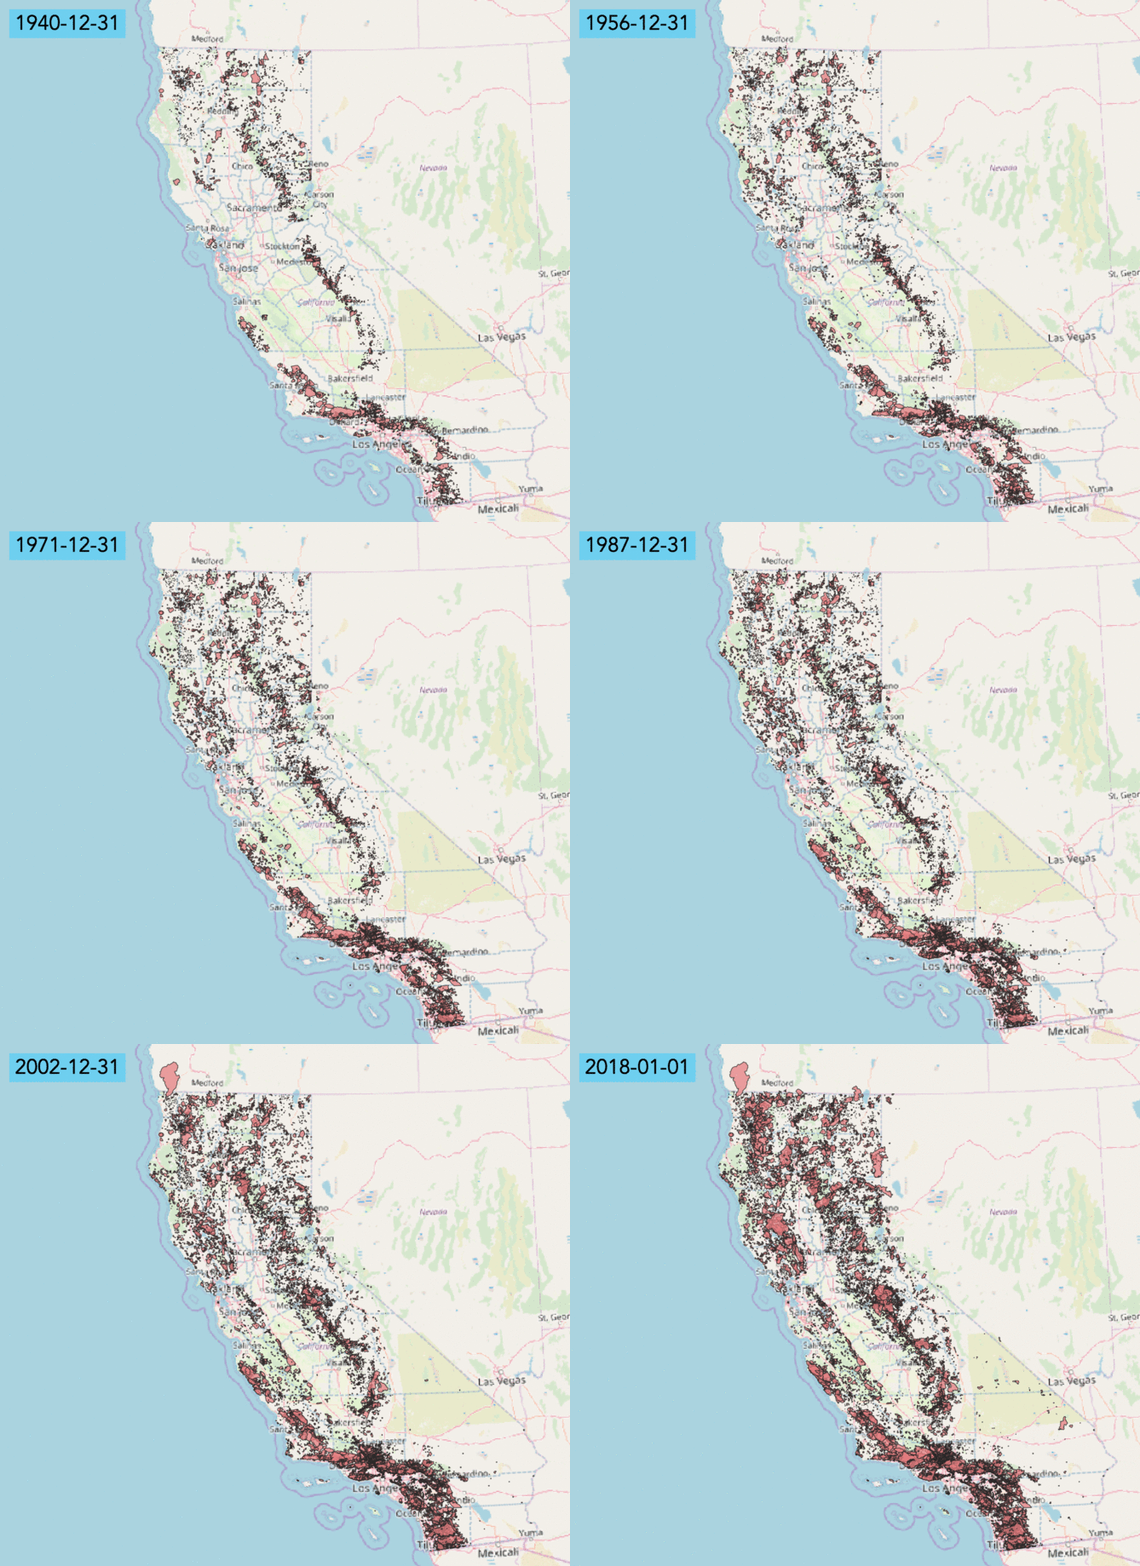
This gif was made using QGIS and the Time Manager Plugin.
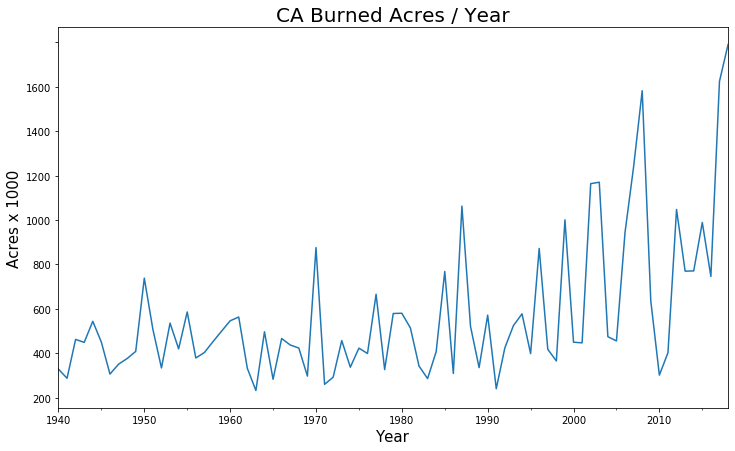
To complement the gifs, I plotted various statistics per year, showing a general increase in fire frequency, land-area impacts, and mega-fire size.
The original data was ammended slightly with QGIS, and from Cal Fire.
The vector layers are available as a shapefile in the project repo.
The data depicts all historical CA fires from 1878 to 2018, including severe notable fires from 2018 (Camp Fire, Carr Fire, Mendocino Complex Fire).


