🔃 (go-to 🇧🇷) Versão em Português
AIndividual activity of the Exploratory Data Analysis discipline of the postgraduate course in Data Analytics at FIAP.
Carry out analysis, according to the guidelines below:
Aditional information: article from Cortex et al.,2009 about the analysis made on the dataset object of this project.
1. Import the winequality-red.csv dataset which can be downloaded from the following link: here.
# importing dataframe
wine_data = pd.read_csv('https://archive.ics.uci.edu/ml/machine-learning-databases/wine-quality/winequality-red.csv', sep=';')
2. Use Pandas to check the structure of the dataset (number of rows, columns, column data types, etc).
# checks the dataset structure
wine_data.dtypes

# checks data distribution in the dataset
wine_data.describe()

# checks dataset informationt
wine_data.info()
- All columns are of type
float64, except thequalitycolumn, which is of typeint64.
# checks duplicate rows in the dataset
wine_data[wine_data.duplicated()]

# deletes duplicate lines, preserving dataframe with information without duplicates
wine_data.drop_duplicates(keep='first', inplace=True)
wine_data.info()

# checks missing data
wine_data.isnull().sum()
No missing data was found in the dataset, after the first treatment carried out: deletion of duplicate lines.
In the article / source from which the dataset is taken, I did not find any definition of the scoring range that determines that a high quality wine is ranked between 8 and 10, for example. Therefore, in order to create some sorte of reference on how this ranking is done, I used the article on the [Famiglia Valduga](https://blog.famigliavalduga.com.br/o-que-e-e-como-funciona-o- wine-scoring-system/) blog, which says the following:
"To assign scores, tasters use a form with standardized criteria, which are evaluated separately to be as technical as possible. In terms of assigning points, it is common to give scores between 50 and 100, with the best wines being above 90. In general, numerical classifications can be interpreted as follows:
- 100 to 90: these are excellent, rare or extraordinary wines;
- 89 to 80: these are wines with few defects and also considered well-made;
- 79 to 70: these are medium wines, which despite being pleasant are not very complex in flavors, aromas or body;
- 69 to 60: these are wines that are below average because they are considered unbalanced or flawed;
- 59 to 50: these are inferior, poor quality wines that are not acceptable for demanding palates."
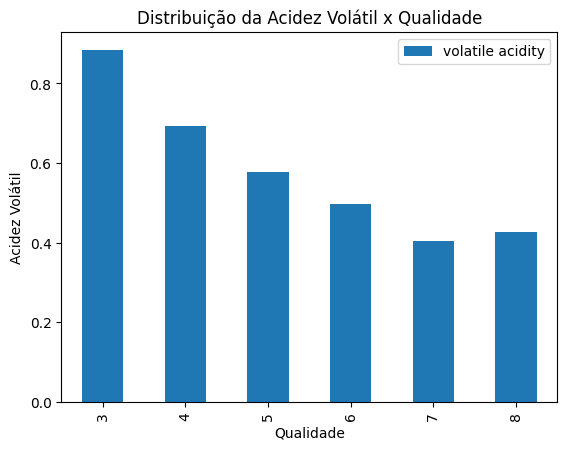
Considering the point of view of the article, it is viable to consider that high quality wines are those that have a score >= 8. So, answering the question, the average volatile acidity of high quality wines, according to the data present in the dataset, it is 0.42764705882352944.
wine_data[wine_data['quality'] >= 8]['volatile acidity'].mean()
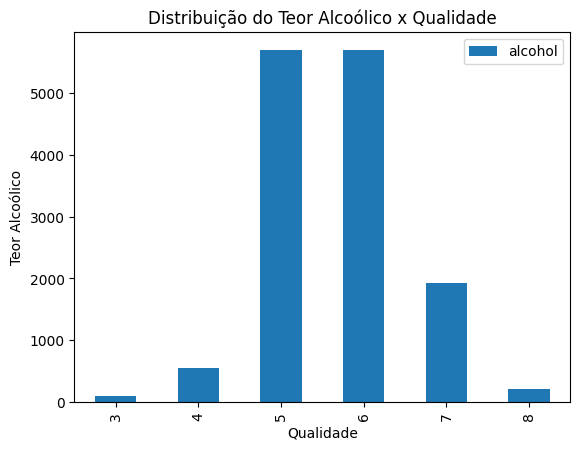
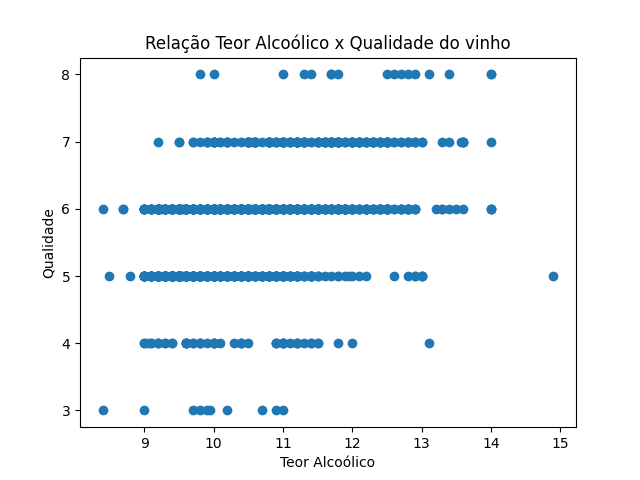
Looking at the graph below, it is possible to notice the relationship between the alcohol content and the quality of the wine is strong, that is, the higher the alcohol content, the higher the quality of the wine. However, according to the article published by Cortex, the alcohol content is just one of the facts that influence the quality of the wine. For the answer to be complete, a broad analysis is necessary that includes all factors relevant to determining the quality of the product.
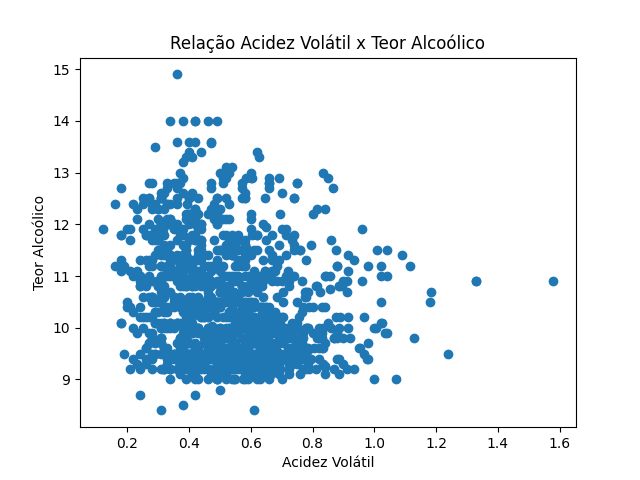
The relationship between these two variables is weak. However, in the graph it is possible to observe that the higher the alcohol content, the lower the volatile acidity.
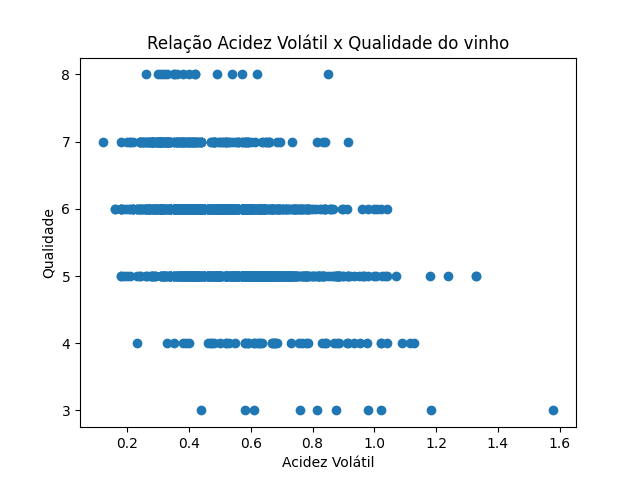
Yes. The graph below demonstrates that the relationship between acidity and quality is strong and that the higher the volatile acidity, the lower the quality of the wine.
Made with ❤️ by Cami Queiroz 🎙 Let´s talk!

