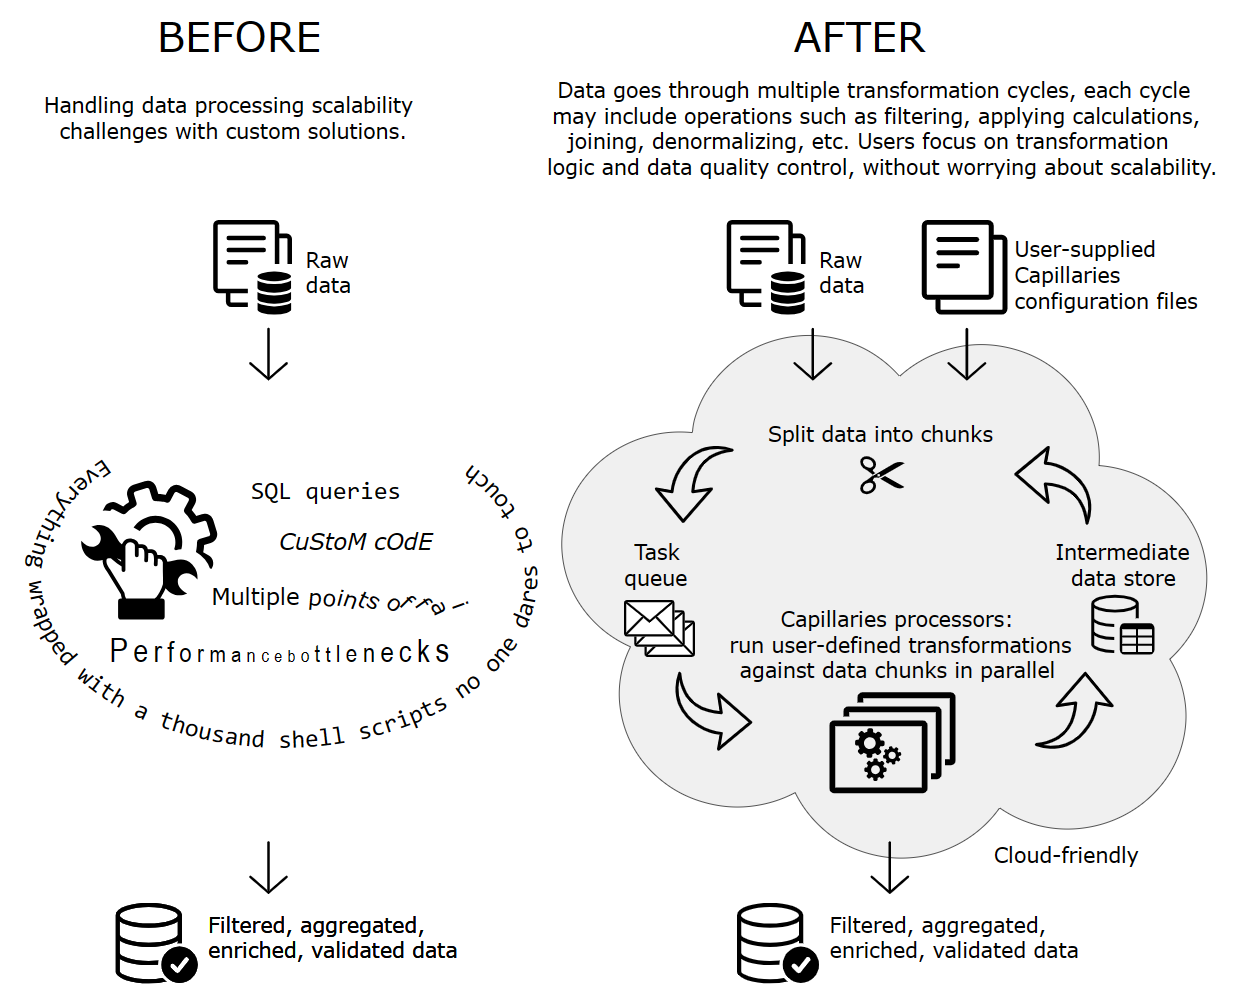
Capillaries is a data processing framework that:
- addresses scalability issues and manages intermediate data storage, enabling users to concentrate on data transforms and quality control;
- bridges the gap between distributed, scalable data processing/integration solutions and the necessity to produce enriched, customer-ready, production-quality, human-curated data within SLA time limits.
| BEFORE | AFTER | |
|---|---|---|
| Cloud-friendly | Depends | Can be deployed to the cloud within minutes; Docker-ready |
| Data aggregation | SQL joins | Capillaries lookups in Cassandra + Go expressions (scalability, parallel execution) |
| Data filtering | SQL queries, custom code | Go expressions (scalability, maintainability) |
| Data transform | SQL expressions, custom code | Go expressions, Python formulas (parallel execution, maintainability) |
| Intermediate data storage | Files, relational databases | on-the-fly-created Cassandra keyspaces and tables (scalability, maintainability) |
| Workflow execution | Shell scripts, custom code, workflow frameworks | RabbitMQ as scheduler, workflow status stored in Cassandra (parallel execution, fault tolerance, incremental computing) |
| Workflow monitoring and interaction | Custom solutions | Capillaries UI, Toolbelt utility, API, Web API (transparency, operator validation support) |
| Workflow management | Shell scripts, custom code | Capillaries configuration: script file with DAG, Python formulas |
On Mac, WSL or Linux, run in bash shell:
git clone https://github.com/capillariesio/capillaries.git
cd capillaries
./copy_demo_data.sh
docker compose -p "test_capillaries_containers" up
Wait until all containers are started and Cassandra is fully initialized (it will log something like Created default superuser role 'cassandra'). Now Capillaries is ready to process sample demo input data according to the sample demo scripts (all copied by copy_demo_data.sh above).
Navigate to http://localhost:8080 to see Capillaries UI.
Start a new Capillaries data processing run by clicking "New run" and providing the following parameters (no tabs or spaces allowed):
| Field | Value |
|---|---|
| Keyspace | portfolio_quicktest |
| Script URI | /tmp/capi_cfg/portfolio_quicktest/script.json |
| Script parameters URI | /tmp/capi_cfg/portfolio_quicktest/script_params.json |
| Start nodes | 1_read_accounts,1_read_txns,1_read_period_holdings |
Alternatively, you can start a new run using Capillaries toolbelt by executing the following command from the Docker host machine, it should have the same effect as starting a run from the UI:
docker exec -it capillaries_webapi /usr/local/bin/capitoolbelt start_run -script_file=/tmp/capi_cfg/portfolio_quicktest/script.json -params_file=/tmp/capi_cfg/portfolio_quicktest/script_params.json -keyspace=portfolio_quicktest -start_nodes=1_read_accounts,1_read_txns,1_read_period_holdings
Watch the progress in Capillaries UI. A new keyspace portfolio_quicktest will appear in the keyspace list. Click on it and watch the run complete - nodes 7_file_account_period_sector_perf and 7_file_account_year_perf should produce result files:
cat /tmp/capi_out/portfolio_quicktest/account_period_sector_perf.csv
cat /tmp/capi_out/portfolio_quicktest/account_year_perf.csv
Besides Capillaries UI at http://localhost:8080, you may want to check out the stats provided by other tools.
Log messages generated by:
- Capillaries Daemon
- Capillaries WebAPI
- Capillaries UI
- RabbitMQ
- Cassandra with Prometheus jmx-exporter
- Prometheus are collected by fluentd and saved in /tmp/capi_log.
To see Cassandra cluster status, run this command (reset JVM_OPTS so jmx-exporter doesn't try to attach to the nodetool JMV process):
docker exec -e JVM_OPTS= capillaries_cassandra1 nodetool status
Cassandra read/write statistics collected by Prometheus available at:
http://localhost:9090/graph?g0.expr=sum(irate(cassandra_clientrequest_localrequests_count%7Bclientrequest%3D%22Write%22%7D%5B1m%5D))&g0.tab=0&g0.display_mode=lines&g0.show_exemplars=1&g0.range_input=15m&g1.expr=sum(irate(cassandra_clientrequest_localrequests_count%7Bclientrequest%3D%22Read%22%7D%5B1m%5D))&g1.tab=0&g1.display_mode=lines&g1.show_exemplars=0&g1.range_input=15m&g2.expr=sum(irate(cassandra_clientrequest_localrequests_count%7Binstance%3D%2210.5.0.11%3A7070%22%7D%5B1m%5D))&g2.tab=0&g2.display_mode=lines&g2.show_exemplars=0&g2.range_input=15m&g3.expr=sum(irate(cassandra_clientrequest_localrequests_count%7Binstance%3D%2210.5.0.12%3A7070%22%7D%5B1m%5D))&g3.tab=0&g3.display_mode=lines&g3.show_exemplars=0&g3.range_input=15m
There is a Kubernetes deployment POC, but it may require some work: Minikube cluster setup, S3 buckets with proper permissions, S3-based Docker image repositories.
Blog at capillaries.io
For more details about this particular demo, see Capillaries blog: Use Capillaries to calculate ARK portfolio performance. To learn how this demo runs on a bigger dataset with 14 million transactions, see Capillaries: ARK portfolio performance calculation at scale.
For more details about getting started, see Getting started.
Capillaries binaries are intended to be container-friendly. Check out the docker-compose.yml and Kubernetes deployment POC, these test projects may be a good starting point for creating your full-scale container-based deployment.
There is Capideploy project at https://github.com/capillariesio/capillaries-deploy which is capable of deploying Capillaries in AWS. Its a work in progress and it's not a production-quality solution yet.
What it is and what it is not (use case discussion and diagrams)
Getting started (run a quick Docker-based demo without compiling a single line of code)
(C) 2022-2024 KH (kleines.hertz[at]protonmail.com)
