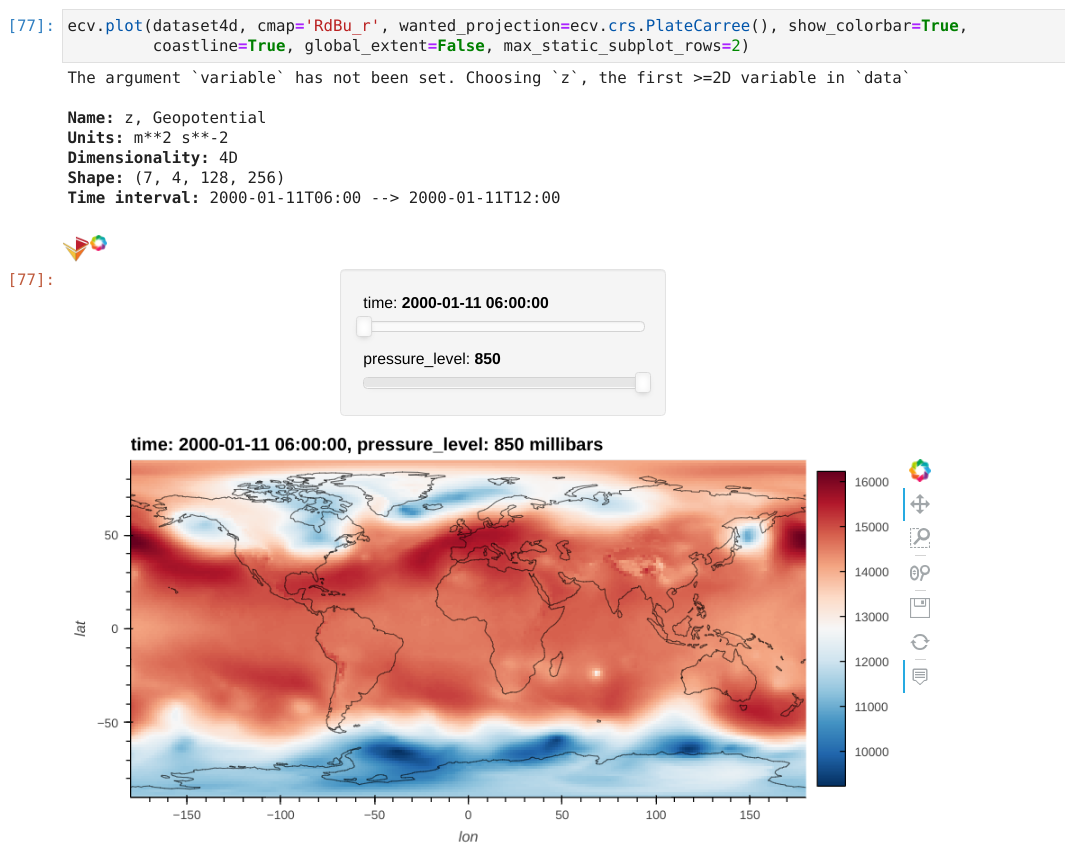
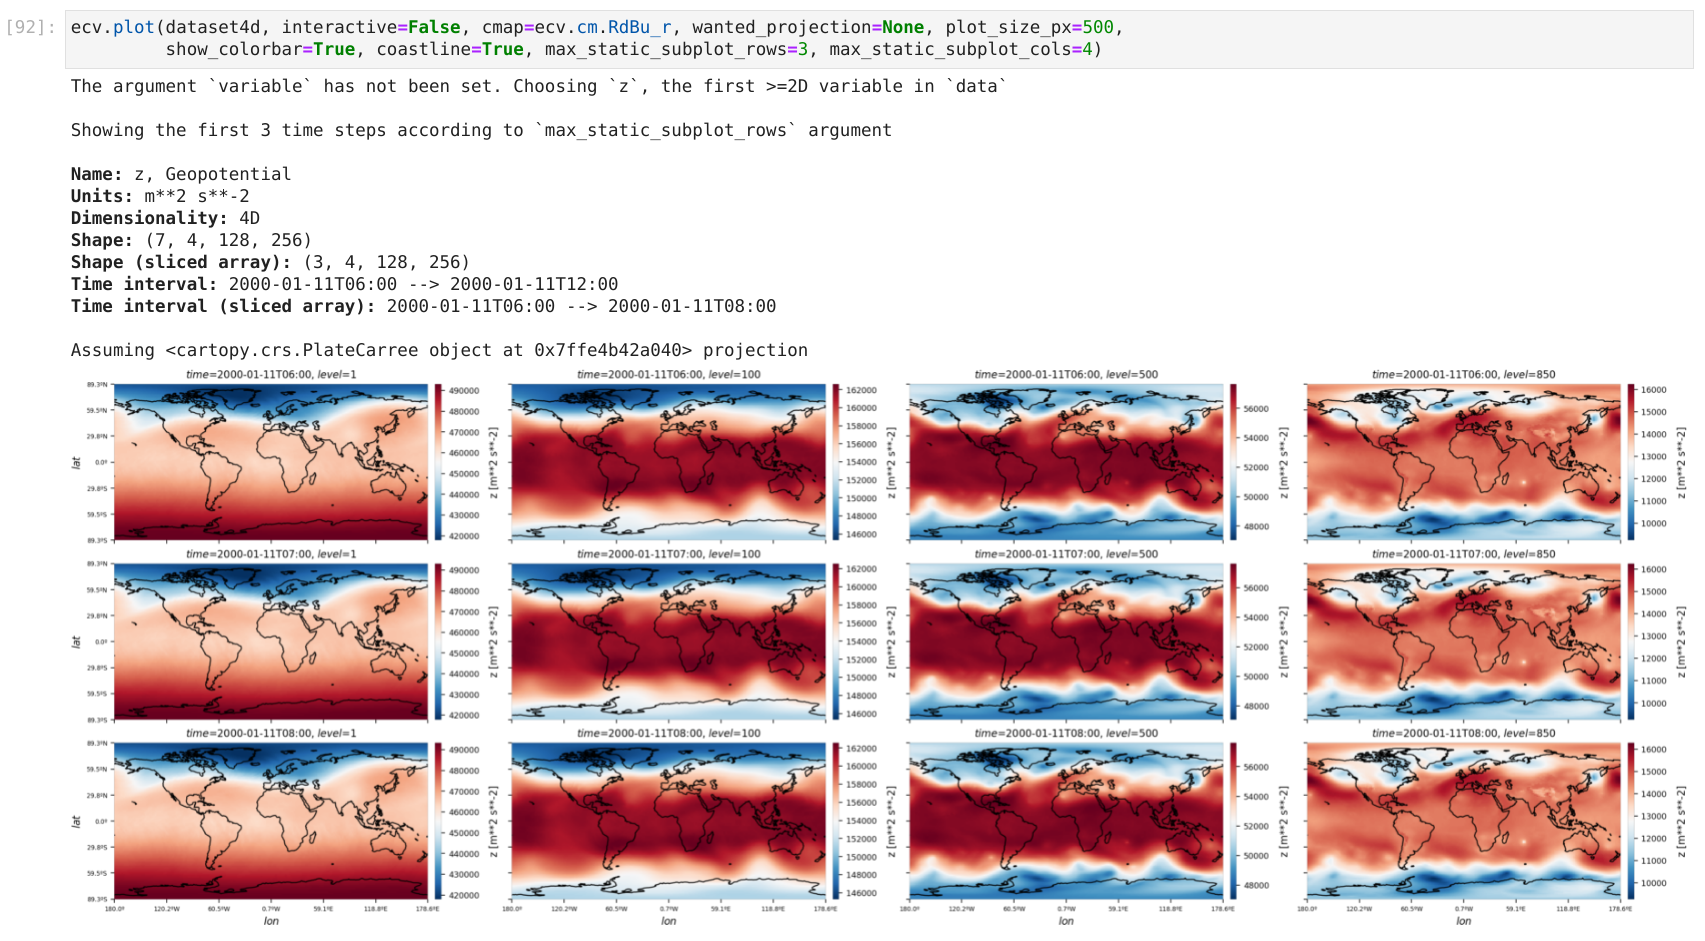
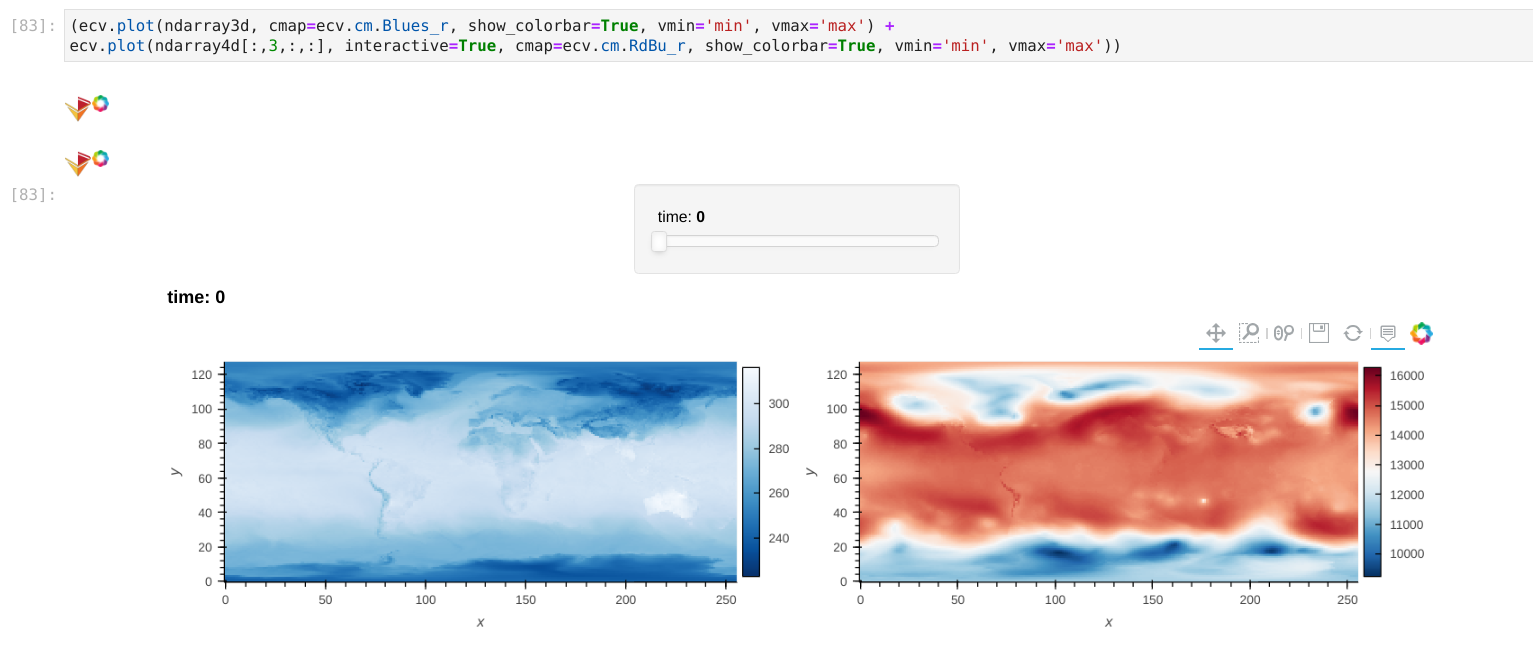
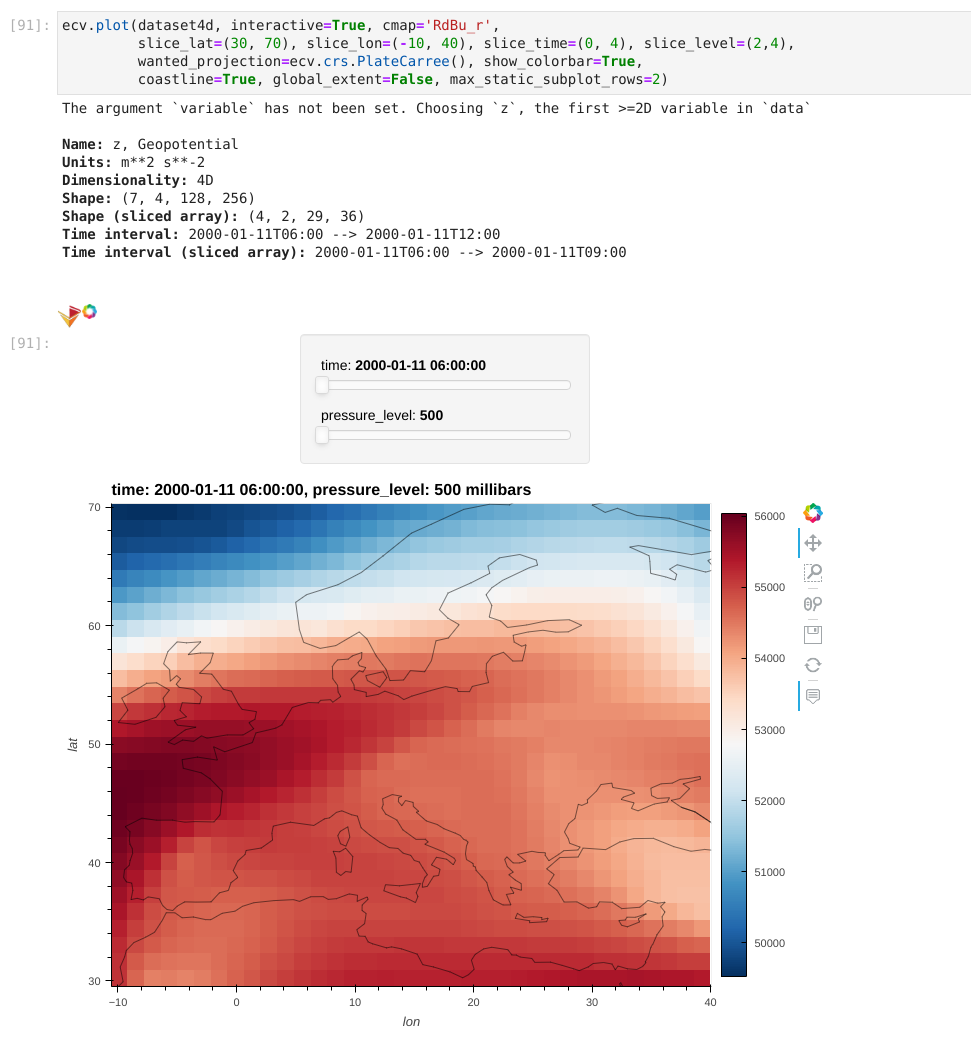
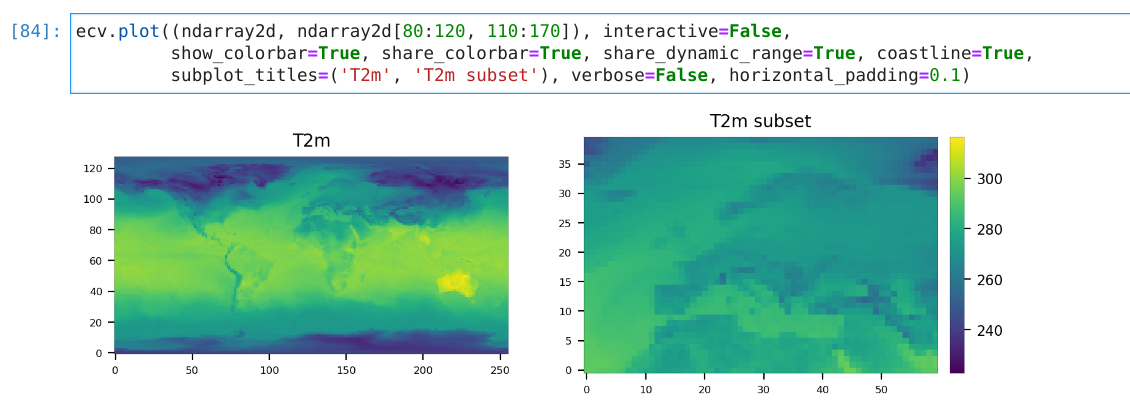
ecubevis: Earth CUBE VISualization with Python. Intended for the interactive exploration of n-dimensional (2D, 3D, 4D or 5D spatio-temporal) arrays on Jupyterlab. Supports both xarray.Dataset/DataArray (with metadata) or numpy.ndarray objects.
Install ecubevis from pypi:
pip install ecubevis
If installing cartopy with pip is not working, use conda:
conda install cartopy
If cartopy kills your Jupyter notebook kernel try this:
pip install shapely --upgrade --force-reinstall --no-binary shapely
Import the library:
import ecubevis as ecvThe main function in ecubevis is ecv.plot(). In interactive mode, the plot comes with sliders (thanks to hvplot/holoviews) allowing easy exploration of multi-dimensional data as 2D arrays across the time and additional dimensions. Under the hood, ecv.plot() calls one of the following functions depending on the data type:
-
ecv.plot_ndarray(): For plotting an in-memorynumpy.ndarrayobject with 2, 3, 4 or 5 dimensions (ndarrays do not carry metadata so the dimensions are given with thedimensionsargument). The function can take a tuple of 2D ndarrays, even with different grid/image size. -
ecv.plot_dataset(): For plotting an in-memoryxr.Datasetorxr.DataArrayobjects with 2, 3, or 4 dimensions. The dimensions expected are [lat, lon] for 2D arrays, [time, lat, lon] for 3D arrays or [time, level, lat, lon] for 4D arrays.
ecubevis will allow you to create:

