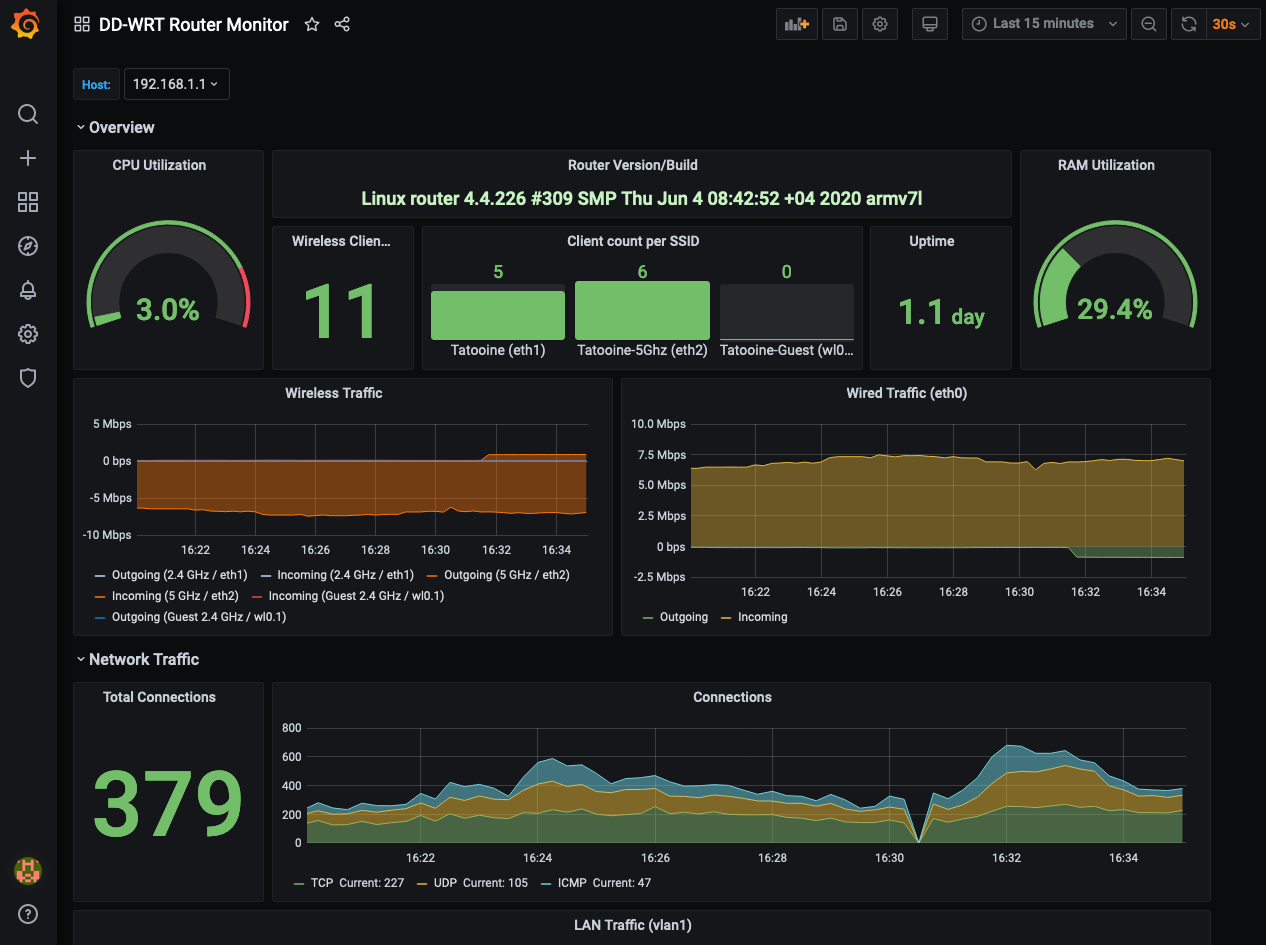
This stack is used to monitor a Netgear R7000P (Nighthawk) router that uses a Broadcom CPU. It might not work on different router brands or models.
- Set an user, password in (Administration -> Management -> Router Password) and enable SSH in (Services -> Secure Shell) to be able to copy files into the router.
- Then enable JFFS in Router GUI to persist files and create the dir
/jffs/snmpd/ - Copy all files from
routerdirectory into router's/jffs/snmpd/scp root@192.168.1.1 router/* /jffs/snmpd - Add execute permission with
chmod +x /jffs/snmpd/*.shssh root@192.168.1.1 chmod +x /jffs/snmpd/*.sh - Disable SNMP on the Service page of the GUI if already enabled (custom config is used)
- Add
snmpd -c /jffs/snmpd/snmpd.confin the startup commands in the GUI (Administration -> Commands -> Save as Startup) - Reboot
The monitoring stack is composed of snmp_exporter, Prometheus, Grafana and Alertmanager. They are run in Docker containers by using a docker-compose file.
- Configure your router IP in the
prometheus/prometheus.ymlfilejob_name -> targetssection. - Run
docker-compose up -d
Grafana, Prometheus and Alertmanager will be configured with provisioned Data Source pointing to http://prometheus:9090 and with the dashboards pre-loaded.
The historical data for Prometheus and configuration changes for Grafana are stored in Docker volumes. If required, this can be changed to the local disk.
The URLs for the stack apps are:
- Grafana: http://localhost:3000
- Prometheus: http://localhost:9090
- Alertmanager: http://localhost:9093
- SNMP-Exporter: http://localhost:9116
