Housing Project Bakeoff
Introduction
This is a project where I am looking to predict housing prices in Seatle, Washington. With this goal in mind i have proceeded in generating features that might assist in providing my predictive models a better understanding of the data. Using this data I set up to answer the following questions:
1. How Good can our model predict our data?
2. Did the grade provided affected the sale of the house?
3. Is there a popular month where sales took place?
Investigation
When reading the data provided and setting it up for predictions. It was necessary, before answering the main question, to read the data and see if the other questions could be answered.
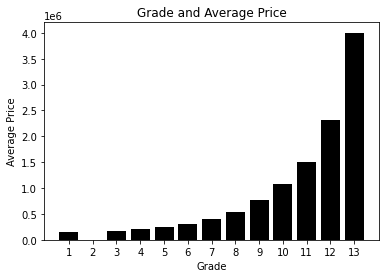
Did the grade provided affected the sale of the house?
In this case it did, its quite aparent that the higher the grade the group of houses was, the higher the price that was sold for.
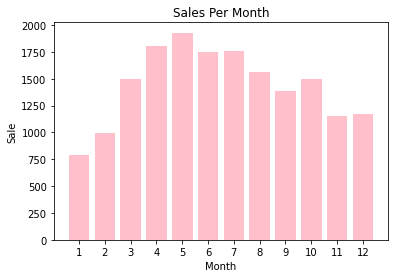
Is there a popular mont where sales took place?
In this case it becomes aparent that April and May show the highest values for sales.
Conclusions
When answering those questions it became aparent that a lot of relational data could be used to create the model. By using polinomials, dummy variables and relational features such as, Month and Sale Numbers or Grade and Sale Price, our model could be improved. Aside than using various features selections, I came to the conclusion that a simple Linear Regression model gave me the best score out of all that we're using.
In conclusion, I am able to state that my Linear Regression model is able to have a Residual Mean of Squares low enoguh to do the best acurate predictions.


