Python API Challenge - WeatherPy
A minimum of 500 unique (non-repeat) cities were sampled based on latitude and longitude to assess weather conditions. Analysis with plotly is available to view. Version with matplotlib is available to view. To determine if weather conditions differ at the equator, the following plots were generated:
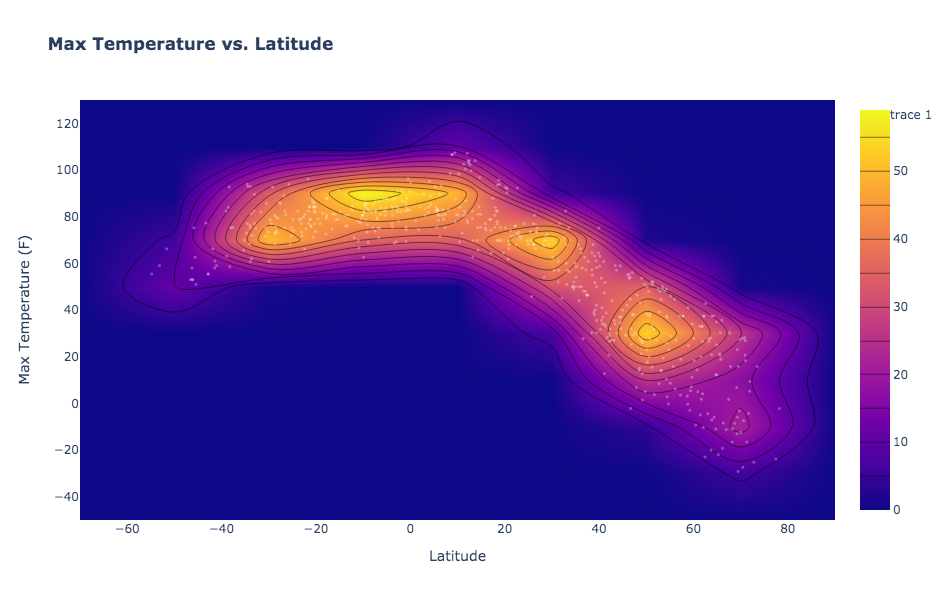
Latitude vs. Max Temperature
Cities located between the latitudes of -20 to 12 report the most elevated temperatures with 75 degrees Fahrenheit and above.
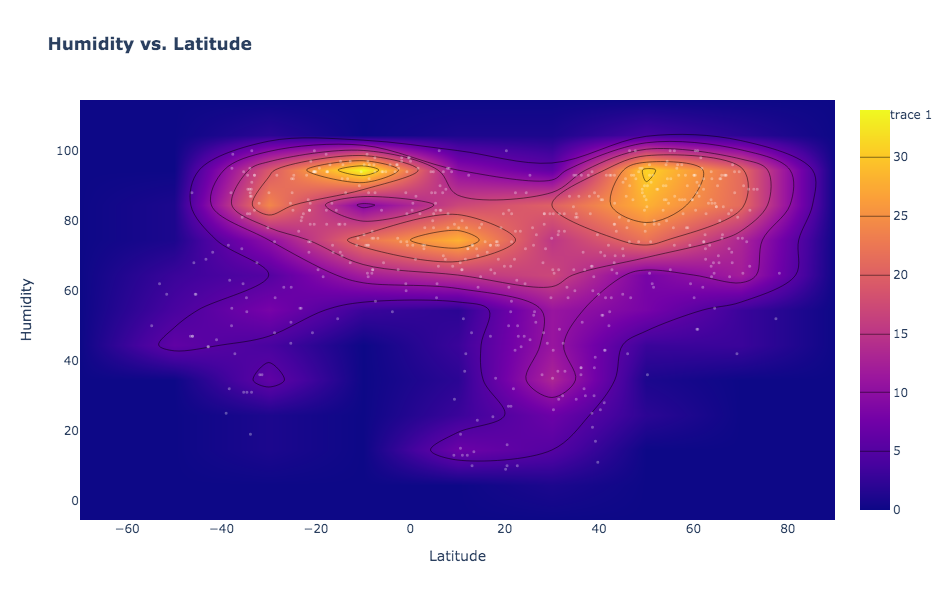
Latitude vs. Humidity (%)
Cities located between the latitudes of 45 to 60 report the most events with 80% humidity and above.
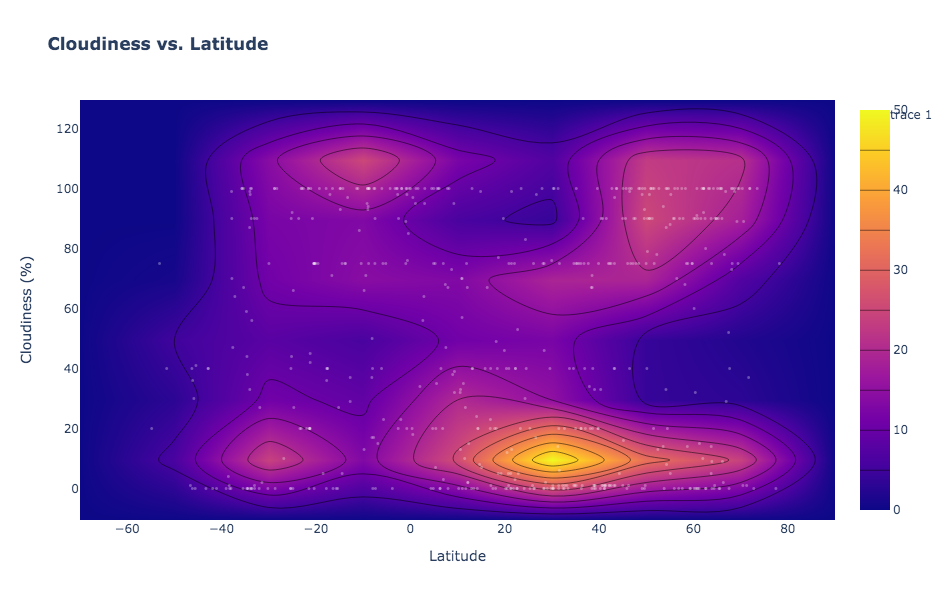
Latitude vs. Cloudiness (%)
There is no correlation with latitude and cloudiness.
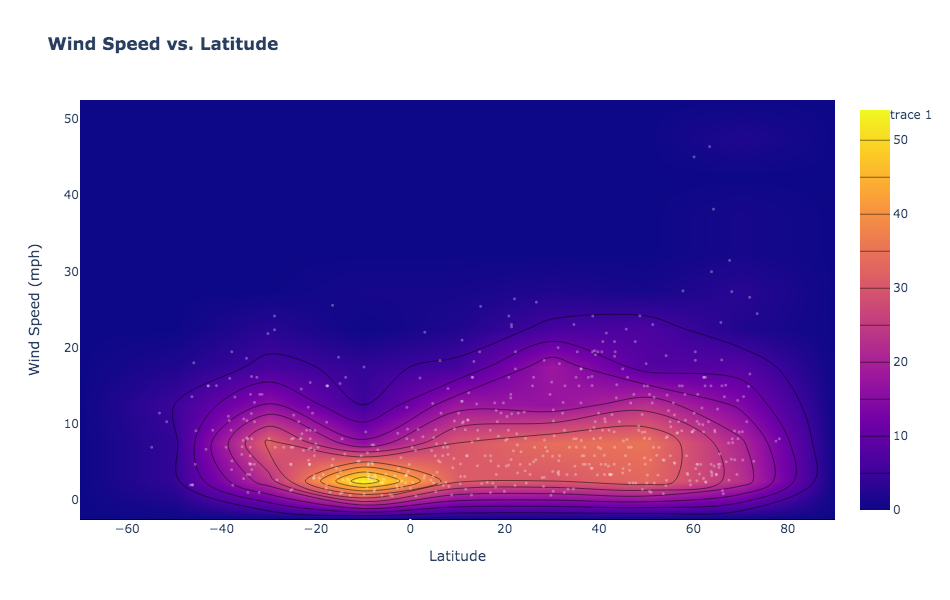
Latitude vs. Wind Speed (mph)
There is no correlation with latitude and wind speeds. As latitude decreases, cities observe less wind events.


