Author: Carl Howe, WG1V
I now have two programs in this repo: JT-Mapper.R, which maps JT65, JT9, and FT8 QSO modes, and WSPR-Mapper which does WSPR receive-only monitoring.
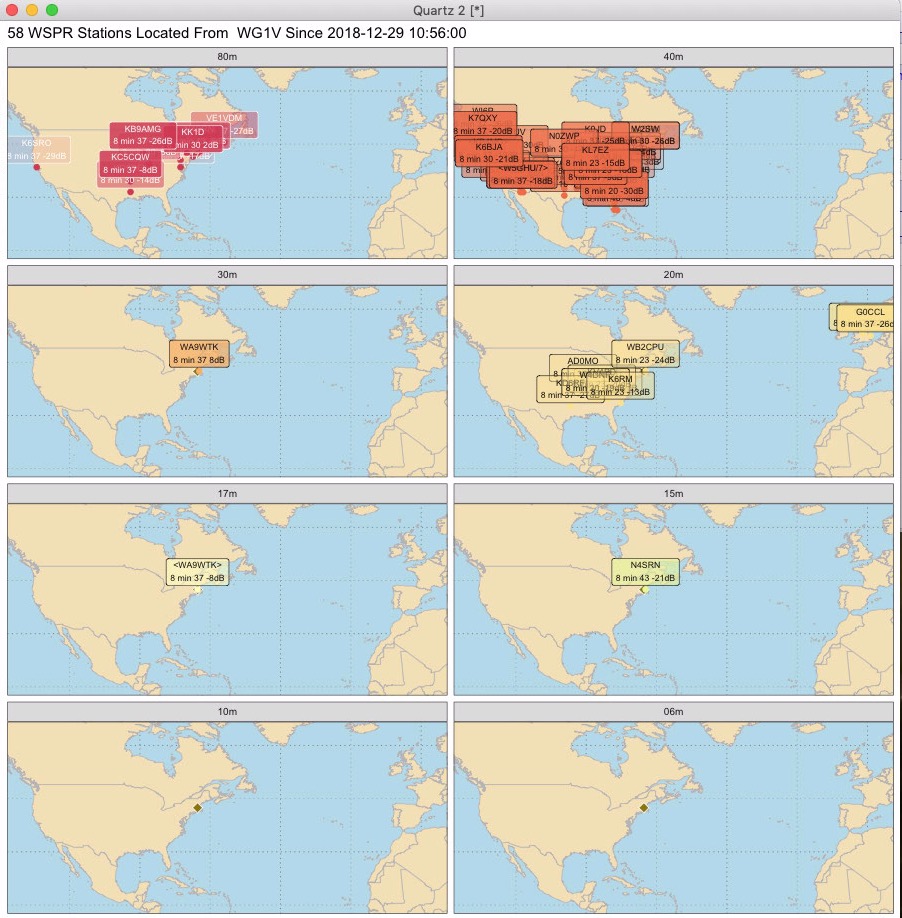
Most of the instructions below are for JT-Mapper, but I've included a screen shot of what the WSPR-Mapper output looks like at the bottom of this file.
I added one enhancement and fixed a bug in this version in preparation for creating a new more dyanmic version of this program (that will be version 2.0) which has a different set of mapping engines.
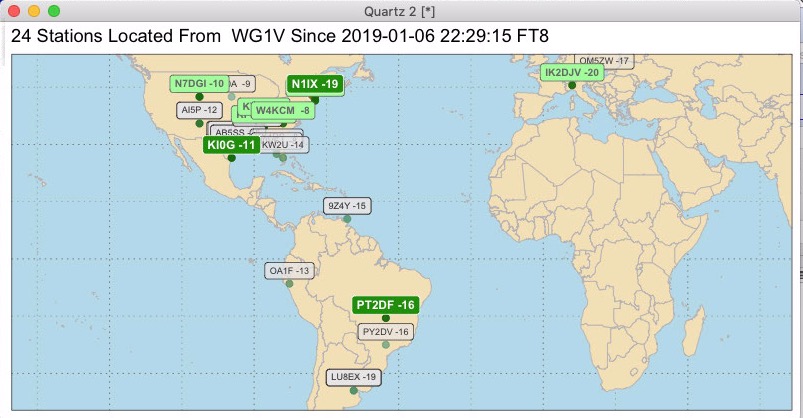
- Added signal reports to the station labels. Now you can see the strength of the signals you're receiving as well as the call signs.
- **Fixed a bug in the FT8 refresh code. I was incorrectly calculating which stations were recently heard, which occasionally resulted in no heard tags.
Fixed a rather confusing bug that incorrectly computed which stations to highlight when starting up in an unknown mode. Also corrected behavior when a read of the log results in a null record.
I've added two major changes in this release:
- Argument parsing: JT-Mapper now has real argument parsing to allow you to specify log file location, enable debugging, change colors, and a host of other options. Type
./JT-Mapper.R --helpor./JT-Mapper.R -hfor the full set of options. - FT 8 support: JT-Mapper now can parse and update its map in 15 second intervals when WSJT-X is in FT8 mode.
These changes should make the program a bit more useful for today's WSJT-X user. I only recently got up on WSJT-X 1.8RC1 so I hadn't noticed FT8 mode until a few weeks ago.
The development of K1JT's JT65 and JT9 protocols have reinvented digital ham radio. Thanks to Joe and other developers of the WSJT-X software program, hams now can work the world with modest transceivers and a computer with an audio card.
WSJT-X not only offers new radio modes to hams, but it provides a software platform to better understand our radio environment. When we look at the WSJT-X's Band Activity display, we see information that we don't typically have in other modes, including:
- Standardized exchanges. Unlike the free text modes such as PSK31 or RTTY, JT65 and JT9 QSOs are highly formal exchanges and can easily be decoded by machine.
- Multiple signal decoding. Instead of being limited to our own QSOs, we can hear and understand multiple QSOs in progress.
- Locations in machine readable form. Unlike more free-form city and country descriptions, JT9 and JT65 include standard four digit grid square locations in their formal QSO exchanges.
- Continuous logging. Every transmitted and received sequence is logged in a file, making it easy for other programs to use information that WSJT-X collects.
During my operating with JT65 and JT9 for about 9 months now, I've found myself constantly looking up grid squares while trying to get a sense of the band's propagation. With all this information already in my computer, I decided that my computer could do more to visualize my radio environment.
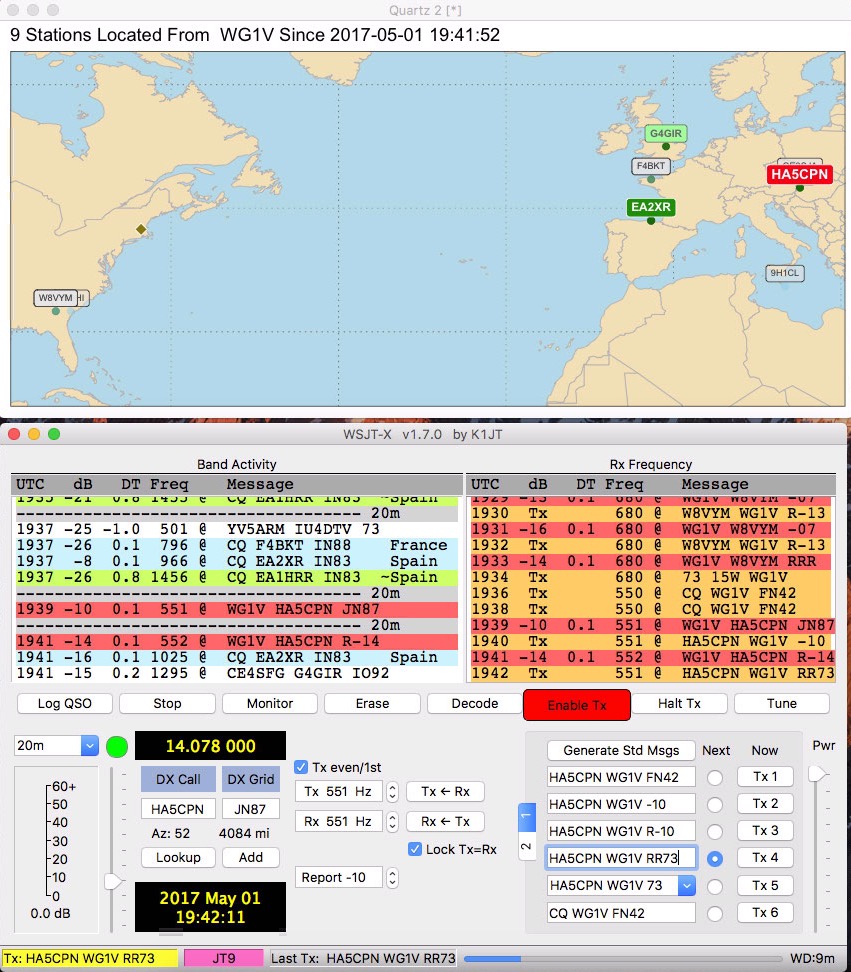
It's easier to show what the program does than to describe it. Here's a screen shot of the mapper in action:
The mapper is running in the window at the top of the screen. The standard WSJT-X Band Activity display is at the bottom.
JT-mapper works very simply. The mapper looks at the last 50 transmissions that WSJT-X has heard (the number 50 is can be configured to your taste). It then displays a map of the stations it has heard during this time. The map is automatically scaled to include just those stations.
In the screen shot shown above, I'm currently engaged in a JT9 exchange with HA5CPN in Hungary, whose call sign is shown in red. While I've been engaged in that QSO, I can also see that EA2XR called CQ during the minute that HA5CPN was responding, as shown by its dark green tag. Meanwhile, G4GIR has been heard communicating with some other station, as shown by the light green marker. Finally, I can see that 9H1CL in Malta and F4BKT in France have been heard earlier on the band, as indicated by their white backgrounds.
By automatically showing you where the stations you can hear are, JT-Mapper gives you an overview of all the stations currently being heard within your transceiver's passband and where they are. The color codes also reflect the progress each station has made through their standardized QSO, allowing you to target new QSOs when they've completed their exchange.
Here are the callsign tags and their colors in table form:
For stations heard over a minute ago, their callsigns and location dots get fainter the older they are.
Note that if you use a different color scheme for coloring your WSJT-X responses than I do (and you probably do), you can change the colors in JT-Mapper to match your palette by changing the variables callingcolor, cqcolor, heardcolor, and oldcolor. All of those variables are defined on the first page of the program.
My station is modest. My rig is an old Icom 706MKIIg HF-VHF-UHF transceiver that feeds an off-center fed dipole. The computer I use is a Mac mini running Mac OS X 10.12.4. It connects to the rig through a Signalink USB audio interface.
While JT-Mapper was designed for Mac OS X, it should run on Linux machines with only parameter changes and one comment change. Running on Windows would require more changes, largely to work around the lack of a tail command to examine the ALL.TXT file.
Before you can run JT-Mapper, you need to install the R programming environment and a collection of packages for plotting and data manipulation. Fortunately, all of these are open source and readily available.
To install R, simply download the appropriate R installer for your platform from r-project.org and run that installer. That will provide you with a base R install. You do not need the optional developer modules.
You invoke R by typing R at your command shell as follows (don't type the % sign -- it's only there to indicate you are typing at a shell):
% R
You should see something like the following:
R version 3.3.2 (2016-10-31) -- "Sincere Pumpkin Patch"
Copyright (C) 2016 The R Foundation for Statistical Computing
Platform: x86_64-apple-darwin13.4.0 (64-bit)

R is free software and comes with ABSOLUTELY NO WARRANTY.
You are welcome to redistribute it under certain conditions.
Type 'license()' or 'licence()' for distribution details.

  Natural language support but running in an English locale

R is a collaborative project with many contributors.
Type 'contributors()' for more information and
'citation()' on how to cite R or R packages in publications.

Type 'demo()' for some demos, 'help()' for on-line help, or
'help.start()' for an HTML browser interface to help.
Type 'q()' to quit R.

>
Once you have R installed, you need to download several external libraries from within R. You can load them all at once by typing the following at the R command prompt (again, don't type the >; that's R's command prompt):
> pkgs <- c('readr', 'stringr', 'ggplot2',
          'maptools', 'lubridate', 'rworldmap', 'dplyr', dependencies=TRUE)
> install.packages(pkgs)
> quit()
Once you have all the packages installed, you'll need to modify the first line of JT-Mapper.R to point to the location of Rscript on your machine. On my Mac, it's in /usr/local/bin, so my first line reads:
#!/usr/local/bin/Rscript
On your system, it might be in /usr/bin or in /var/local/bin. You can find out where Rscript lives by typing the following at the shell prompt
% which Rscript
Once you've made that small change to JT-Mapper.R, type the following steps at your shell command line:
% chmod 755 ./JT-Mapper.R
% ./JT-Mapper.R number-of-lines your-call-sign your-grid
If you don't include a number of lines, the number of lines will default to 50. If you don't type in a callsign and grid, JT-Mapper will use default variables values in the program, namely my callsign (WG1V) and my grid location (FN42). To make JT-Mapper always use your callsign and grid locator, open a text editor (TextEdit works well on Mac OS X), and change the variables mycall and mygrid.
Once you have wsjtxlines, mycall, and mygrid set properly in the program itself, all you need to do to run JT-Mapper is type:
% ./JT-Mapper.R
At present, the program doesn't remember those values between runs unless you change the variables in the program itself.
To run JT-Mapper on Linux, you must modify the new_window function at the top of the file. Simply comment out the line that begins with quartz and replace it with the currently commented line that starts with x11. The change is necessary because of the different R functions used in the two operating systems create a new window for the map.
As noted below, the program uses the tail utility to read the last 50 lines of the WSJT-X ALL.TXT file. That utility doesn't exist under native Windows. I should probably change that code to use a function that performs the same function in R. Clearly I haven't gotten around to that yet.
JT-Mapper is written in R, a high-level language typically used by data scientists for its analytical and visualization capabilities. While I developed this software on Mac OS X, it can be run on Linux as well just by tweaking some of the variables at the beginning of the program.
The basic operation of the program is a simple 5 step process:
- Wait until the 52 second mark of each minute.
- At 52 seconds past the minute, run the
tailutility read the last 50 lines of the ALL.TXT file written by the WSJT-X program. On Macs, this is kept in/Users/username/Library/Application Support/WSJT-X/. On other operating systems it is in a different place; you can adjust the location by changing the variableloglocation. You can also adjust the number of lines the program reads by adding a first argument on the command line or by changing the variablewsjtxlines. - Find all the transmissions that have a grid locator at the end of the line, and convert that to a longitude and latitude.
- For all the transmissions that don't have a grid locator in them, see if the sending callsign has sent a grid locator in the last 50 lines and use that location instead.
- Categorize the label for the call by whether the transmission occurred within the last minute and whether it contained our call or a CQ.
Much of the complexity of the program comes from trying to properly scale the map to include all the stations heard while not plotting too much or trying to scale the map past 180 degrees of longitude and 90 degrees of latitude. The current code is not optimal or even particularly well-structured, but it works and I'm sticking with it until I rewrite all the mapping code to use better maps and real projections.
I wrote this program to satisfy my own JT65 and JT9 operating interests and needs. As such, it is very much a work in progress and has many shortcomings. To prevent others from being surprised, here's a quick rundown of things that the program doesn't do well:
- Handing midnight GMT: When midnight GMT comes, the program doesn't recognize and categorize new transmissions correctly until older sequences aren't in the list of last 50 transmissions. This is because it sorts the list according to just GMT time, not time and date.
- Handling long and unusual callsigns: The program callsign parser is pretty ad-hoc, and doesn't really understand extended callsigns. It muddles through, but it could do better.
- Overplotting: If you hear many calls at once, they by necessity will overwrite each other on the map. You can reduce this by reducing the number of lines of log you process each run, but the program doesn't make any effort to avoid the issue.
- The map isn't a proper projection: R is happy to do map projections, but doing them with a high resolution isn't very fast. Instead of slowing down the plotting for the prettiest plot, I simply plot latitude and longitude using a rectangular grid. As a result, many of the countries and continents are distorted from their actual shapes and areas.
I'm sure there are many more bugs; feel free to clone this repository and fix issues that bother you. And by all means, let me know if you modify the code to do nifty new things or to work better on other platforms. I can be reached at:
The same mapping engine can be used with slight modifications to monitor WSPR reception. Because most of us use WSPR for studying propagation, WSPR-Mapper displays its data on 8 different maps for different bands -- this is referred to as a faceted display. It looks like this:
The labeling of stations is a little more detailed than in JT-Mapper -- you get signal strength, station power, and the amount of time since we last heard the station.
The main thing to know about WSPR-mapper is that it only shows you the last hour's worth of signals. If the bands are dead, it can be really boring to watch.
Happy mapping!
Carl Howe wg1v@carlhowe.com


