cert-checker is a certificate monitoring utility for watching tls certificates. These checks get exposed as Prometheus metrics to be viewed on a dashboard, or soft alert cluster operators.
This tool is heavily inspired by the awesome version-checker by jetstack.
Table of contents generated with markdown-toc
cert-checker supports the following types of certificate errors (and possible more):
- Expired certificates
- Wrong host
- Bad root certificates
- Revoked certificate
- Cipher suites not allowed
dh480dh512nullrc4
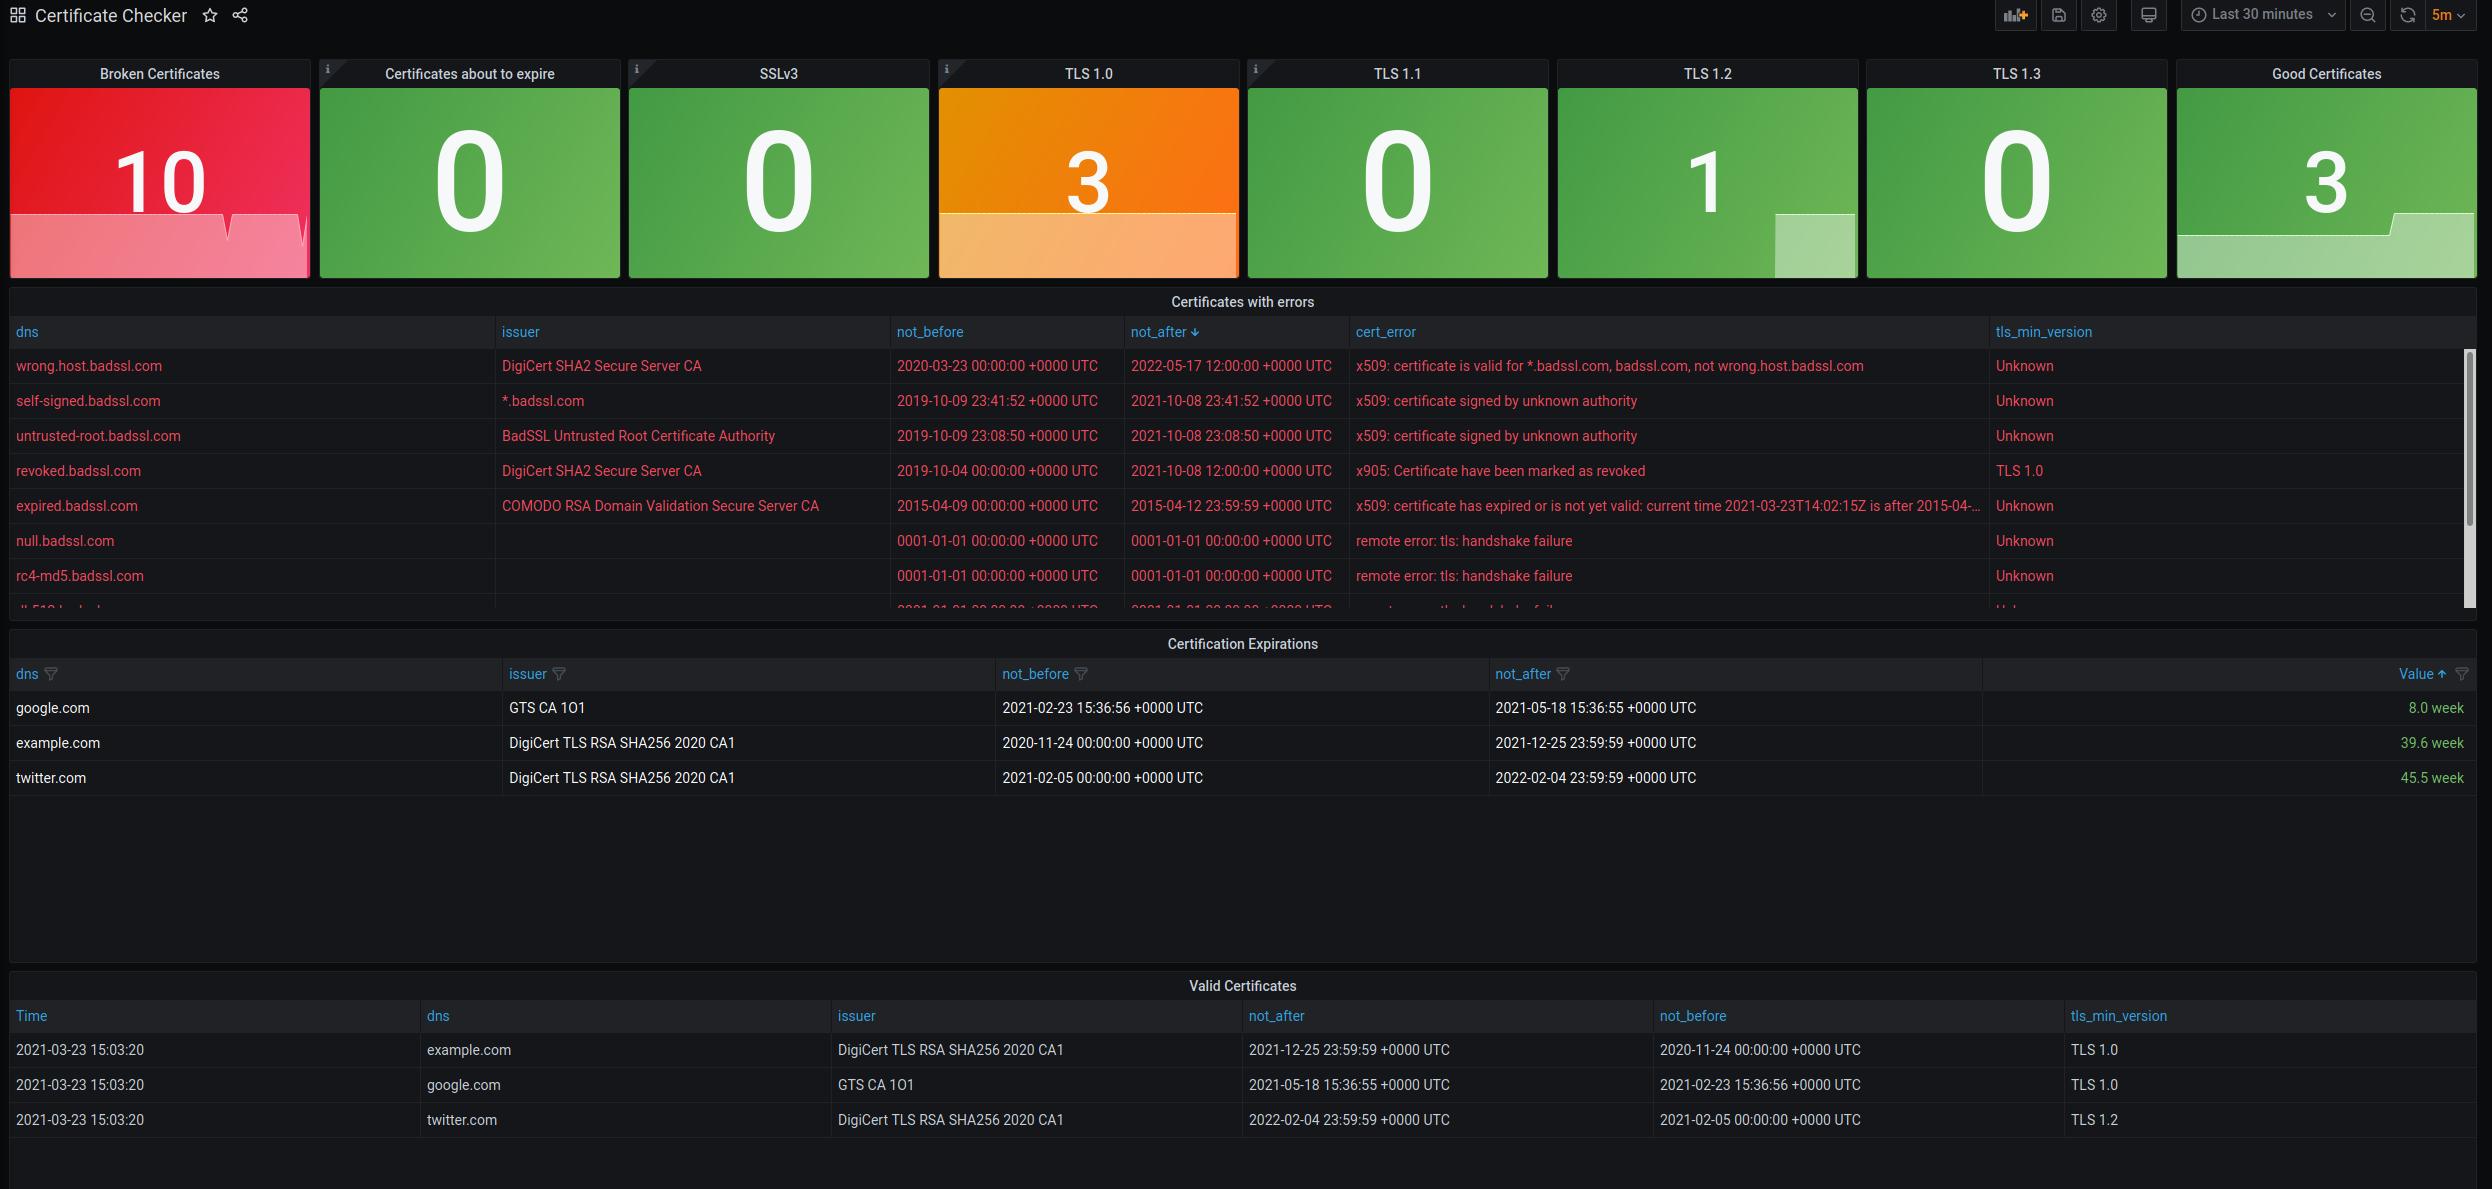
If cert-checker finds any certificate errors, these are displayed on the Grafana dashboard.
cert-checker checks the minimum supported SSL/TLS version for the endpoints.
The following SSL/TLS versions are tested:
- SSL 3.0 - Deprecated in 2015
- TLS 1.0 - Deprecated in 2020
- TLS 1.1 - Deprecated in 2020
- TLS 1.2
- TLS 1.3
See Transport Layer Security for more info.
The minimum supported versions are displayed on the Grafana dashboard.
A great bonus of how the cert-checker is implemented is that it can run without root, and without CAP_NET_RAW capability.
And without Administrator privileges in Windows.
cert-checker can be installed as a standalone static binary from the release page
Create a config file like the below example:
config.yaml:
loglevel: debug
port: 8080  # Optional
intervalminutes: 10
certificates:
    - dns: google.com
    - dns: expired.badssl.com
./cert-checker -c config.yaml
DEBU[2021-05-17T17:27:44+02:00] Probing all
INFO[2021-05-17T17:27:44+02:00] serving ui on 0.0.0.0:8081
INFO[2021-05-17T17:27:44+02:00] serving metrics on 0.0.0.0:8080/metrics
DEBU[2021-05-17T17:27:44+02:00] Probing: google.com
...
# Now open browser at:
# - http://localhost:8081/
# - http://localhost:8080/metricsYou can use the published docker image like this:
First create a config file as above, or download the demo file:
curl https://raw.githubusercontent.com/mogensen/cert-checker/main/config.yaml -O# Start docker container (mounting the config file may be different on OSX and Windows)
docker run -p 8081:8081 -p 8080:8080 -v ${PWD}/config.yaml:/app/config.yaml mogensen/cert-checker:latest
# Now open browser at:
# - http://localhost:8081/
# - http://localhost:8080/metricsSee released docker images on DockerHub
This repository contains an example of deploying the entire Prometheus, Grafana and cert-checker stack, using docker-compose.
cd deploy/docker-compose/
docker-compose up -d| Service | URL |
|---|---|
| cert-checker | ui endpoint http://localhost:8081/ |
| cert-checker | metrics endpoint http://localhost:8080/metrics |
| Prometheus | example query http://localhost:9090/graph?g0.expr=cert_checker_expire_time{}&g0.tab=0 |
| Grafana | Dashboard http://localhost:3000/d/cert-checker/certificate-checker |
Remember to edit the deploy/docker-compose/cert-checker/config.yaml with the actual domains you want to monitor..
See stefanprodan/dockprom for more Prometheus, Grafana, AlertManager examples using Docker-compose
cert-checker can be installed as static manifests:
$ kubectl create namespace cert-checker

# Deploy cert-checker, with kubernetes services and demo configuration
$ kubectl apply -n cert-checker -f deploy/yaml/deploy.yaml

# If you are using the Grafana sidecar for loading dashboards
$ kubectl apply -n cert-checker -f deploy/yaml/grafana-dashboard-cm.yaml

# If you are using the Prometheus CRDs for setting up scrape targets
$ kubectl apply -n cert-checker -f deploy/yaml/servicemonitor.yaml
Remember to edit the configmap with the actual domains you want to monitor..
cert-checker can be installed as as helm release:
$ kubectl create namespace cert-checker
$ helm install cert-checker deploy/charts/cert-checker --namespace cert-checker
Depending on your setup, you may need to modify the ServiceMonitor to get Prometheus to scrape it in a particular namespace.
See this.
You may also need to add additional labels to the ServiceMonitor.
If you have installed the prometheus-community/kube-prometheus-stack with the name of prometheus the following should work:
$ helm upgrade cert-checker deploy/charts/cert-checker \
    --namespace cert-checker            \
    --set=grafanaDashboard.enabled=true \
    --set=serviceMonitor.enabled=true   \
--set=serviceMonitor.additionalLabels.release=prometheuscert-checker can be installed using kustomize:
Create a kustomization.yaml file:
apiVersion: kustomize.config.k8s.io/v1beta1
kind: Kustomization
namespace: cert-checker
resources:
- github.com/mogensen/cert-checker/deploy/yaml
# optionally pin to a specific git tag
# - github.com/mogensen/cert-checker/deploy/yaml?ref=cert-checker-0.0.6

# override confimap with your required settings
patchesStrategicMerge:
- |-
    apiVersion: v1
    kind: ConfigMap
    metadata:
      name: cert-checker
      namespace: cert-checker
    data:
      config.yaml: |
        loglevel: info
        intervalminutes: 60
        certificates:
            - dns: my-very-own-domain.com
Use the kustomization.yaml file to preview and deploy cert-checker:
$ kustomize build kustomization.yaml | less # preview yaml manifests
$ kustomize build kustomization.yaml | kubectl apply --dry-run=client -f - # dry-run apply manifests
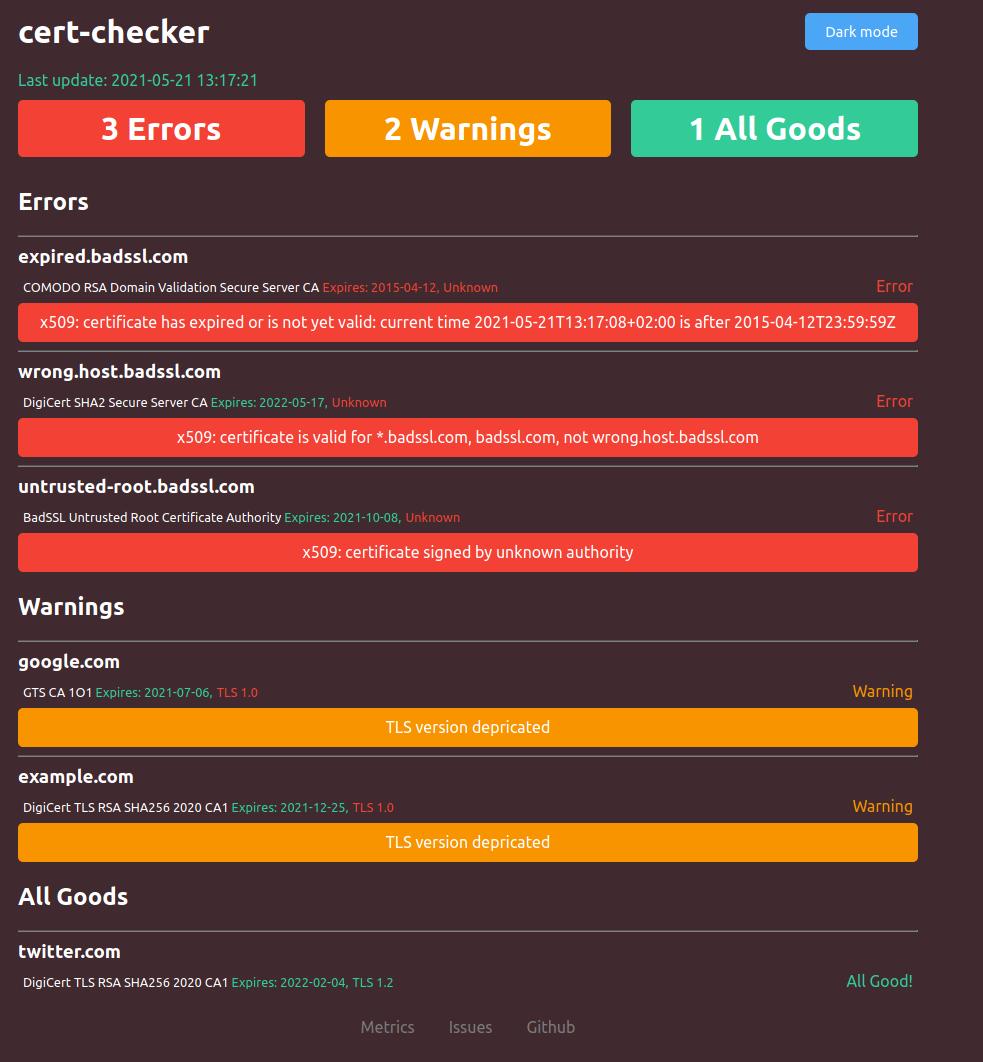
$ kustomize build kustomization.yaml | kubectl apply -f - # deploy manifestsBy default, cert-checker will expose a web ui on http://0.0.0.0:8081/.
Web dashboard
By default, cert-checker will expose the version information as Prometheus
metrics on http://0.0.0.0:8080/metrics.
A Grafana dashboard is also included in this repository.
It is located in the deployment folder: deploy/yaml/grafana-dashboard-cm.yaml
Grafana Dashboard
The dashboard shows the following
- Number of Broken Certificates
- Number of Certificates about to expire
- Number of Good Certificates
- A list with Certificates with errors
- A list of Certificates Expirations for valid certificates
- Minimum TLS versions supported
The conventions used on the dashboard are:
- Red (text or background): Something is broken, and should be fixed!
- Orange (text or background): Something smells, and should properly be fixed!
- Green (text or background): All is good! Go drink coffee!
By default, without the flag -c, --config, cert-checker will
use a config file located next to the binary named config.yaml.
This is currently the only flag / option available.
$ cert-checker -h
Certificate monitoring utility for watching tls certificates and reporting the result as metrics.

Usage:
  version-checker [flags]

Flags:
  -c, --config string   config file (default is config.yaml) (default "config.yaml")
-h, --help help for version-checkerTest the full setup in Kubernetes with Prometheus and Grafana dashboards:
# First create a new kind cluster locally, and install prometheus
make dev-kind-create
# Build a docker image, load it into kind and deploy cert-checker and promeheus/grafana stuff
make image dev-kind-install
Access the local infrastructure here:
| System | URL |
|---|---|
| Prometheus | http://prometheus.localtest.me/graph?g0.expr=cert_checker_is_valid&g0.tab=1&g0.stacked=0&g0.range_input=1h |
| Grafana | http://grafana.localtest.me/d/cert-checker/certificate-checker |
| Build-in dashboard | http://cert-checker.localtest.me/ |


