Created by Celeste Muniz - Lithgow
This is a tale of two cities on either side of the Hudson River. Citibike is available in Jersey City and New York, giving people a convenient and eco-friendly option for traveling locally.
Using the latest Citibike trip history data (December 2020) for Jersey City and New York City, I've analyzed the use of Citibike in both locations. Utilizing Tableau Public, I've created an interactive visual story of my observations.
- Go to this Tableau Public Link: https://public.tableau.com/profile/celeste.m2243#!/vizhome/citibike_hw_16128210087790/CitiBikeDEC2020
- Scroll down to the lower right hand side of the slide and click "Full Screen" mode.

- Start with CitiBikeDEC2020 story and view my presentation.
The data provided by Citibike has information for each ride: trip duration in seconds, station id's, station names, bike id, start/ end times, birth year, gender, and membership level (usertype). Using jupyter notebook, I made smaller csv files focused on specific attributes that would help me tell a visual story.
- Jersey City End Stations
- Jersey City Start Stations
- Jersey City Usertype Count
- Jersey City Trips
- Jersey City Age
- New York City End Stations
- New York City Start Stations
- New York City Usertype Count
- New York City Trips
- New York City Age
-
Total number of rides is significantly higher in NYC with a total of 1,088,929 rides. JC has a total number of 11,694 rides.
-
In both JC and NYC, monthly subscribers make up the majority of users who took rides this month.
-
In both NYC and JC, customers have a higher average trip duration than subscribers.
-
NYC riders have longer trip durations than JC riders.
-
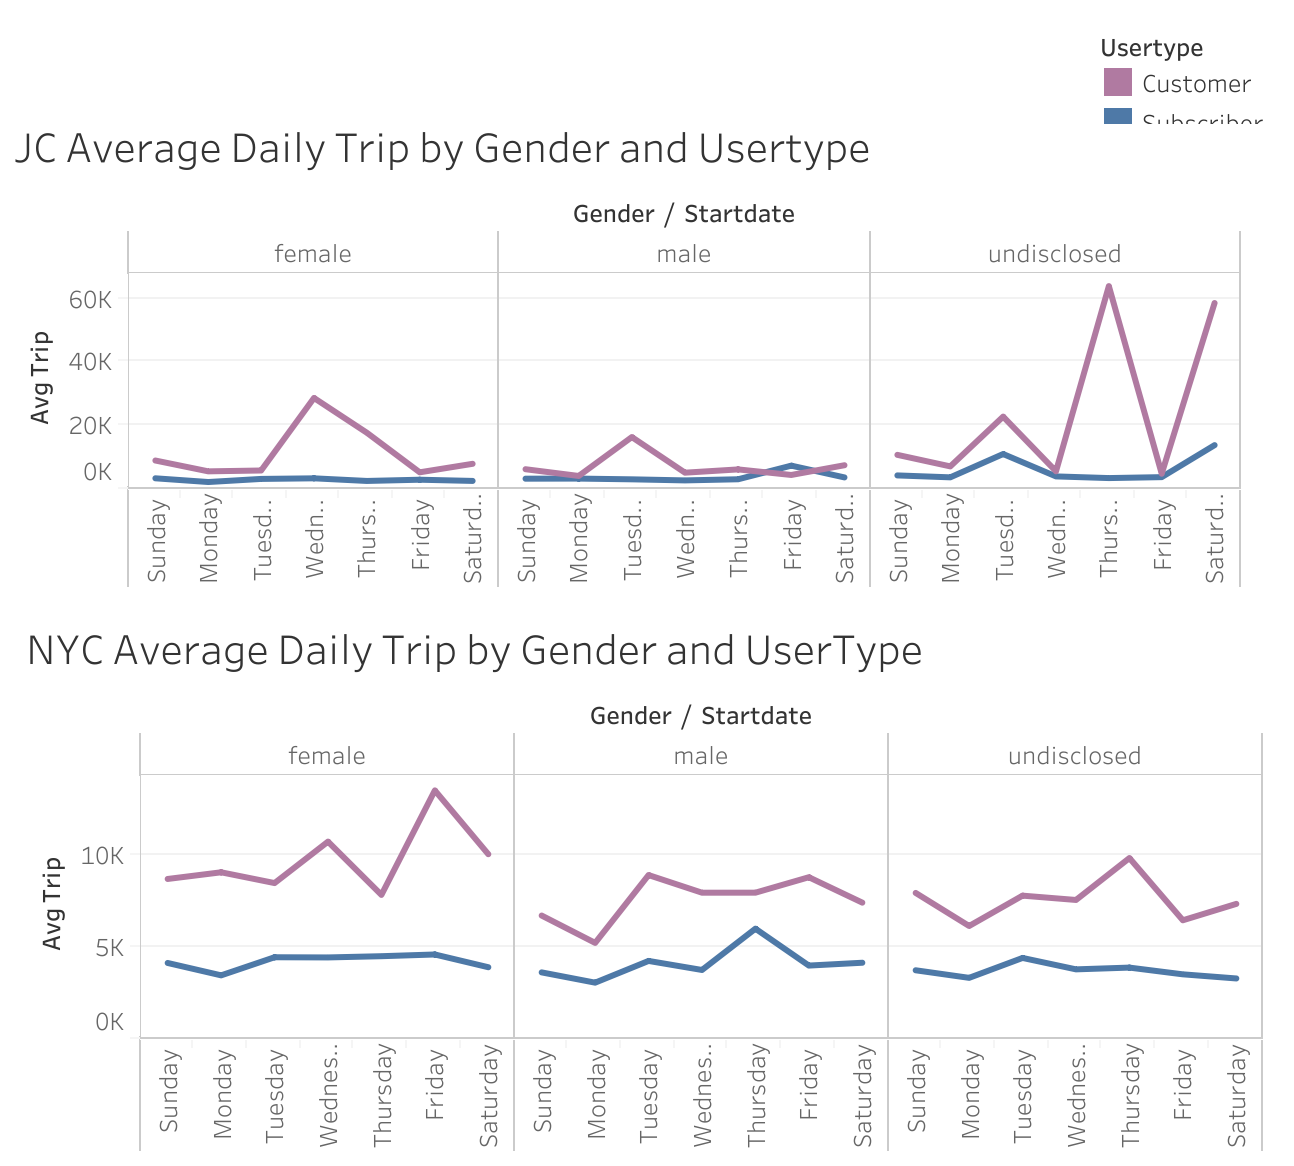
Women in both NYC and JC took longer rides than men and riders who did not disclose thier gender.
-
Midweek is the most popular time to ride.
-
In both NYC and JC riders 50-59 make up the majority of the customers.
-
In both NYC and JC riders 30-39 make up the majority of the subscribers.
-
JC barely has any riders under 21. Although NYC has more riders under 21, this is not a significant age range for NYC either.
-
Most elderly riders are subscribers.
-
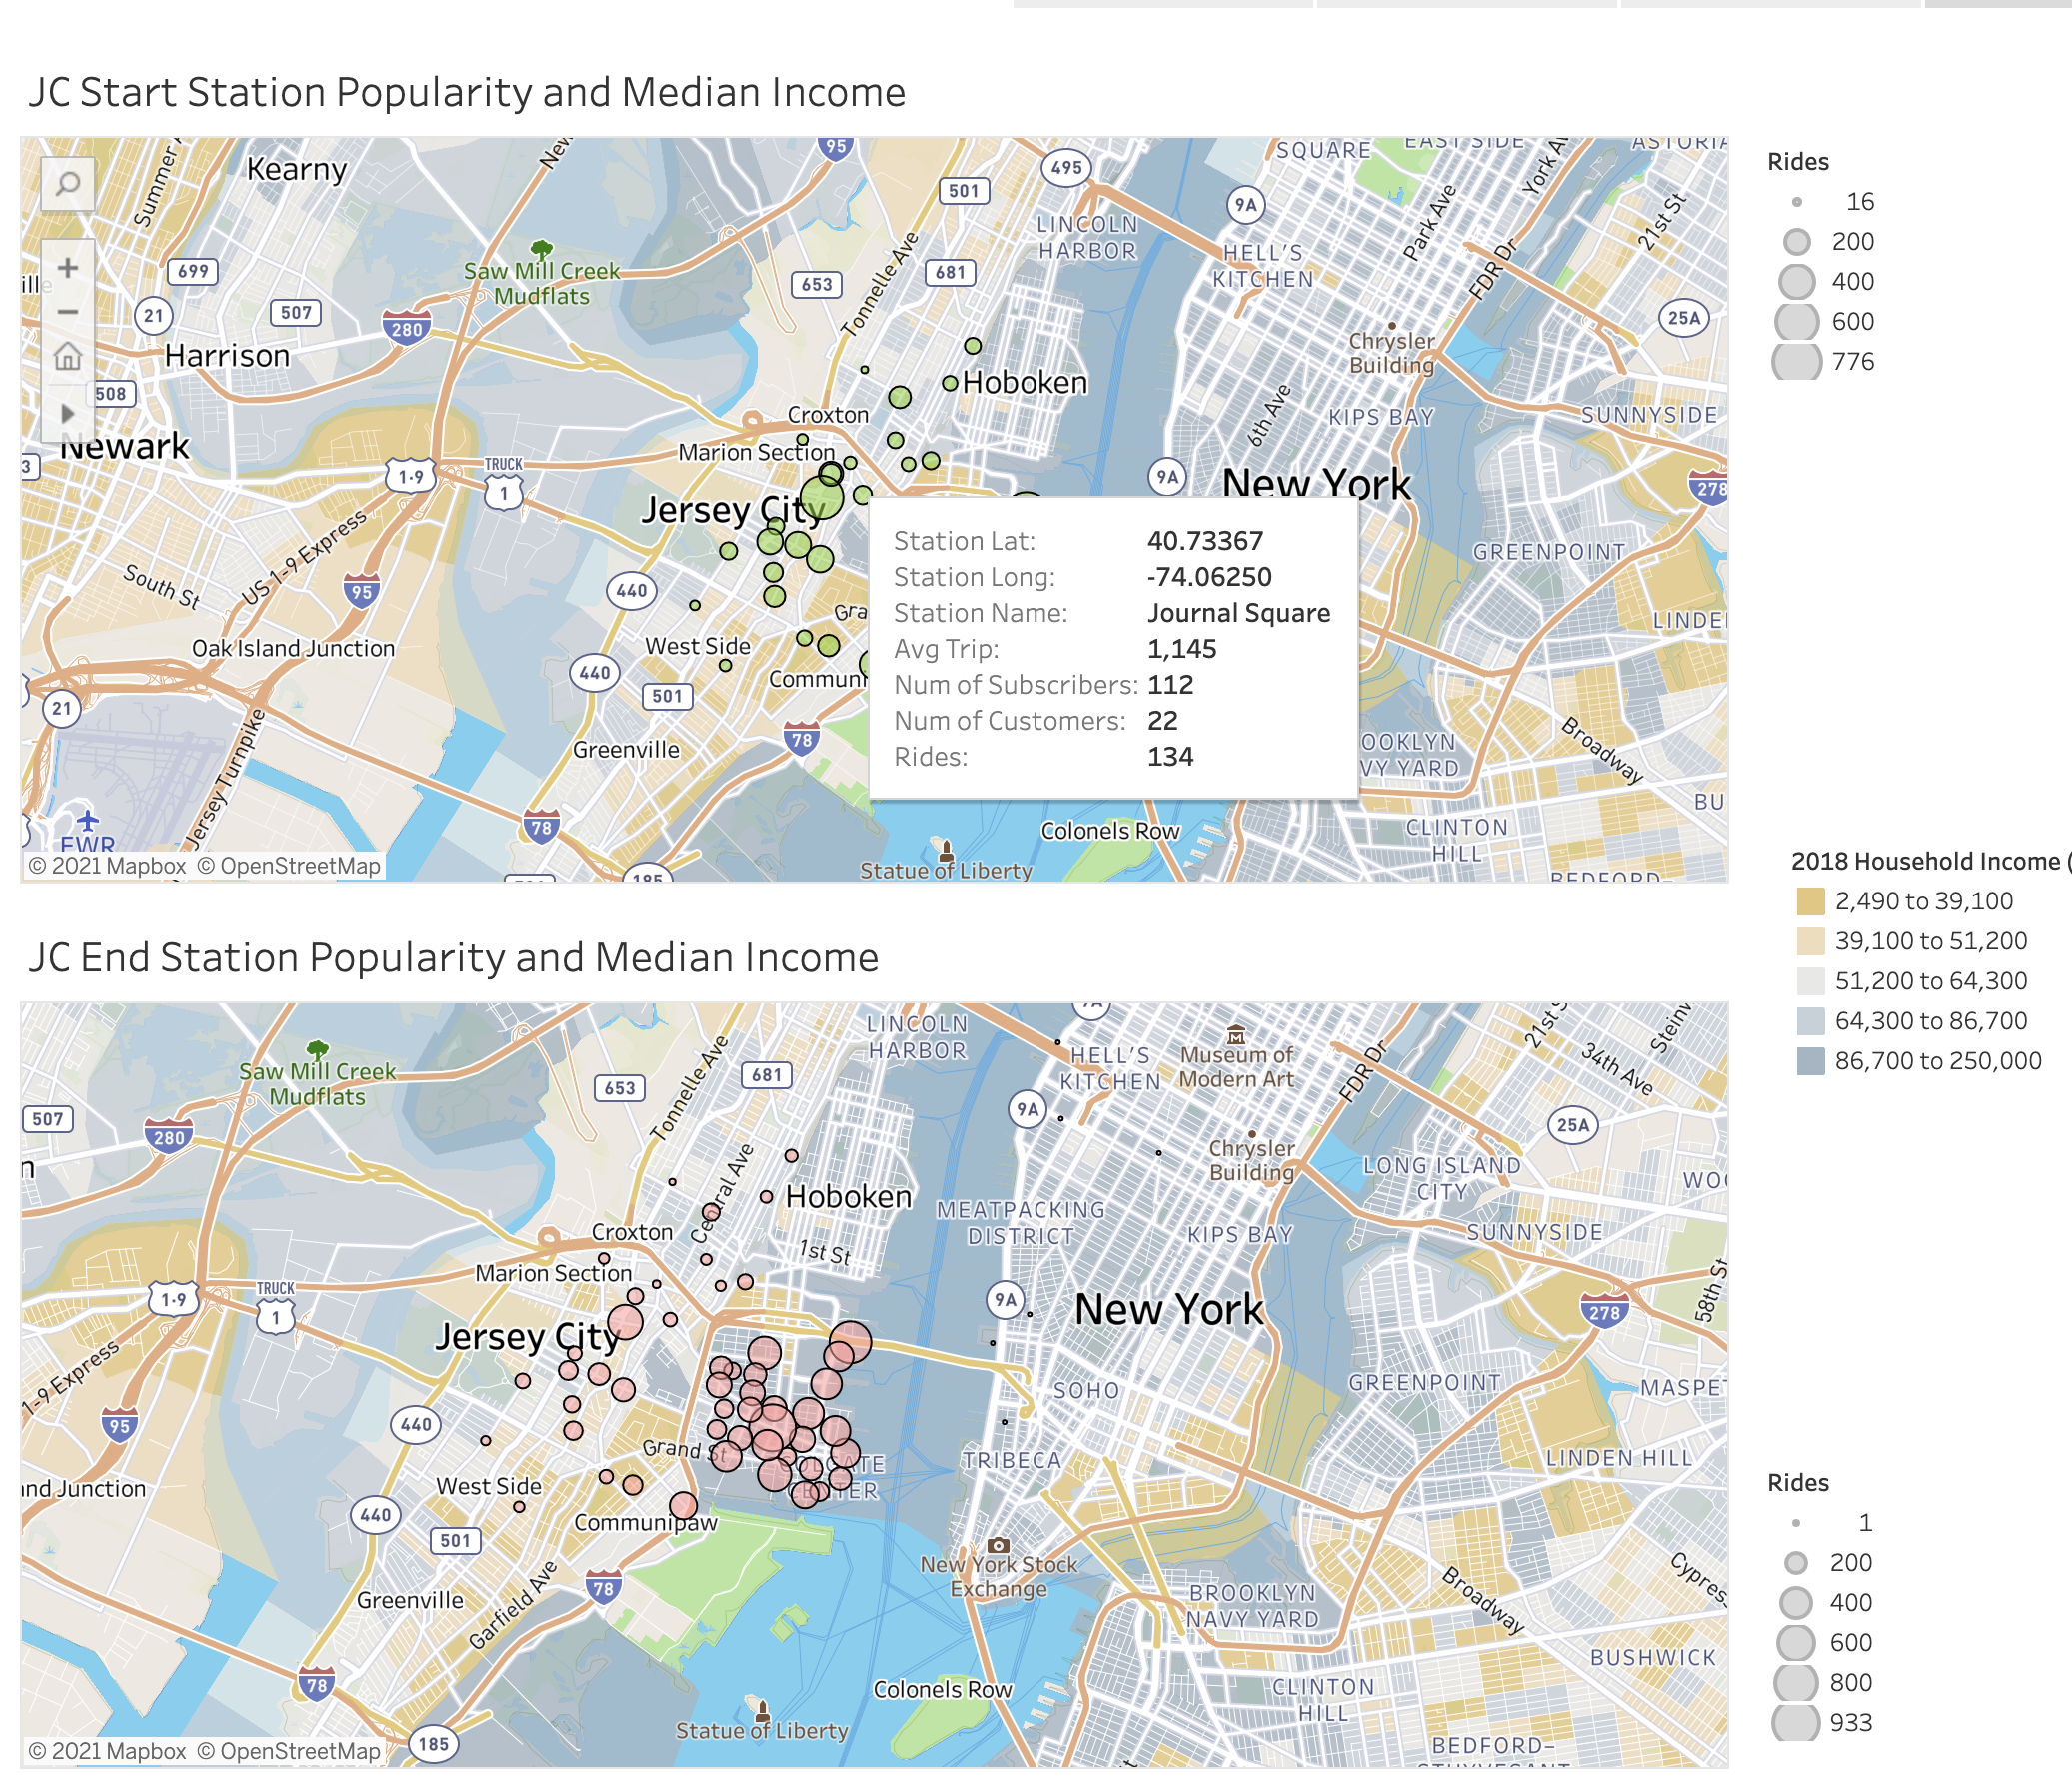
JC has significantly less stations than NYC.
-
Areas with stations are concentrated in neighborhoods with a higher median household income. Neighborhoods with a low median household income have no stations.
-
The popularity of these stations are also concentrated in areas with high median income.
-
Some popular JC ending stations are actually located in NYC near popular commuter locations such as Port Authority and downtown piers.
-
NYC has a distinctly higher amount of stations than JC.
-
Similar to JC, areas in NYC with stations are concentrated in neighborhoods with a higher median household income. Neighborhoods with a low median household income have no stations.
-
A majority of the Bronx, Queens, Brooklyn and the entirety of Staten Island do not have stations.
-
The most popular starting and ending stations are also located in areas with higher income.
- Tableau Public
- Jupyter Notebook
- Python
- Pandas
- Excel


