Created by Celeste Muniz - Lithgow
In this assignment, I built an interactive dashboard to explore the Belly Button Biodiversity dataset, which catalogs the microbes that colonize human navels.
It's a dirty job, but somebody's got to do it.
The dataset reveals that a small handful of microbial species (also called operational taxonomic units, or OTUs, in the study) were present in more than 70% of people, while the rest were relatively rare.
The dataset:
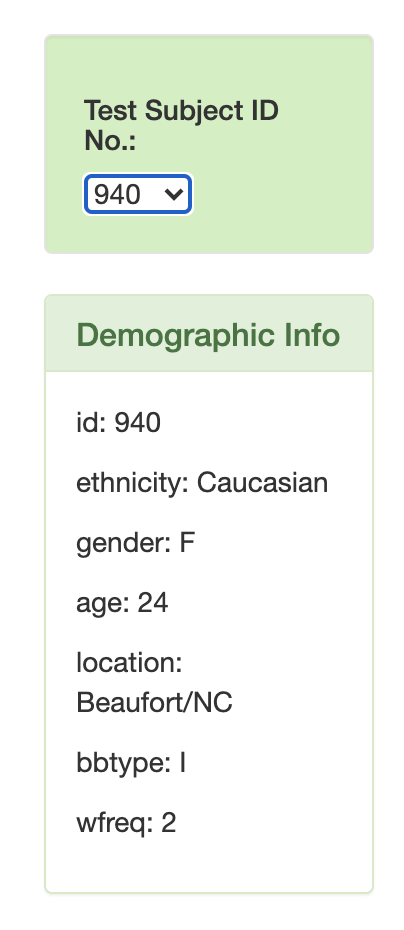
- I populated a dropdown menu with all of the Sample ID's. When an option is selected, this will update all of the charts.
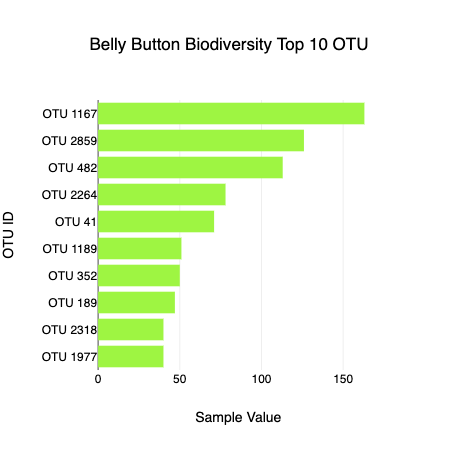
- I created a horizontal bar chart to display the top 10 OTUs found in selected individual.
- I created a bubble chart that displays each sample.
- BONUS Challenge: I created a gauge chart to plot the weekly belly button washing frequency of the selected individual.
I deployed my page to GitHub pages:
https://celeste1030.github.io/plotly-challenge/
Plot.ly
JavaScript
HTML
Bootstrap


