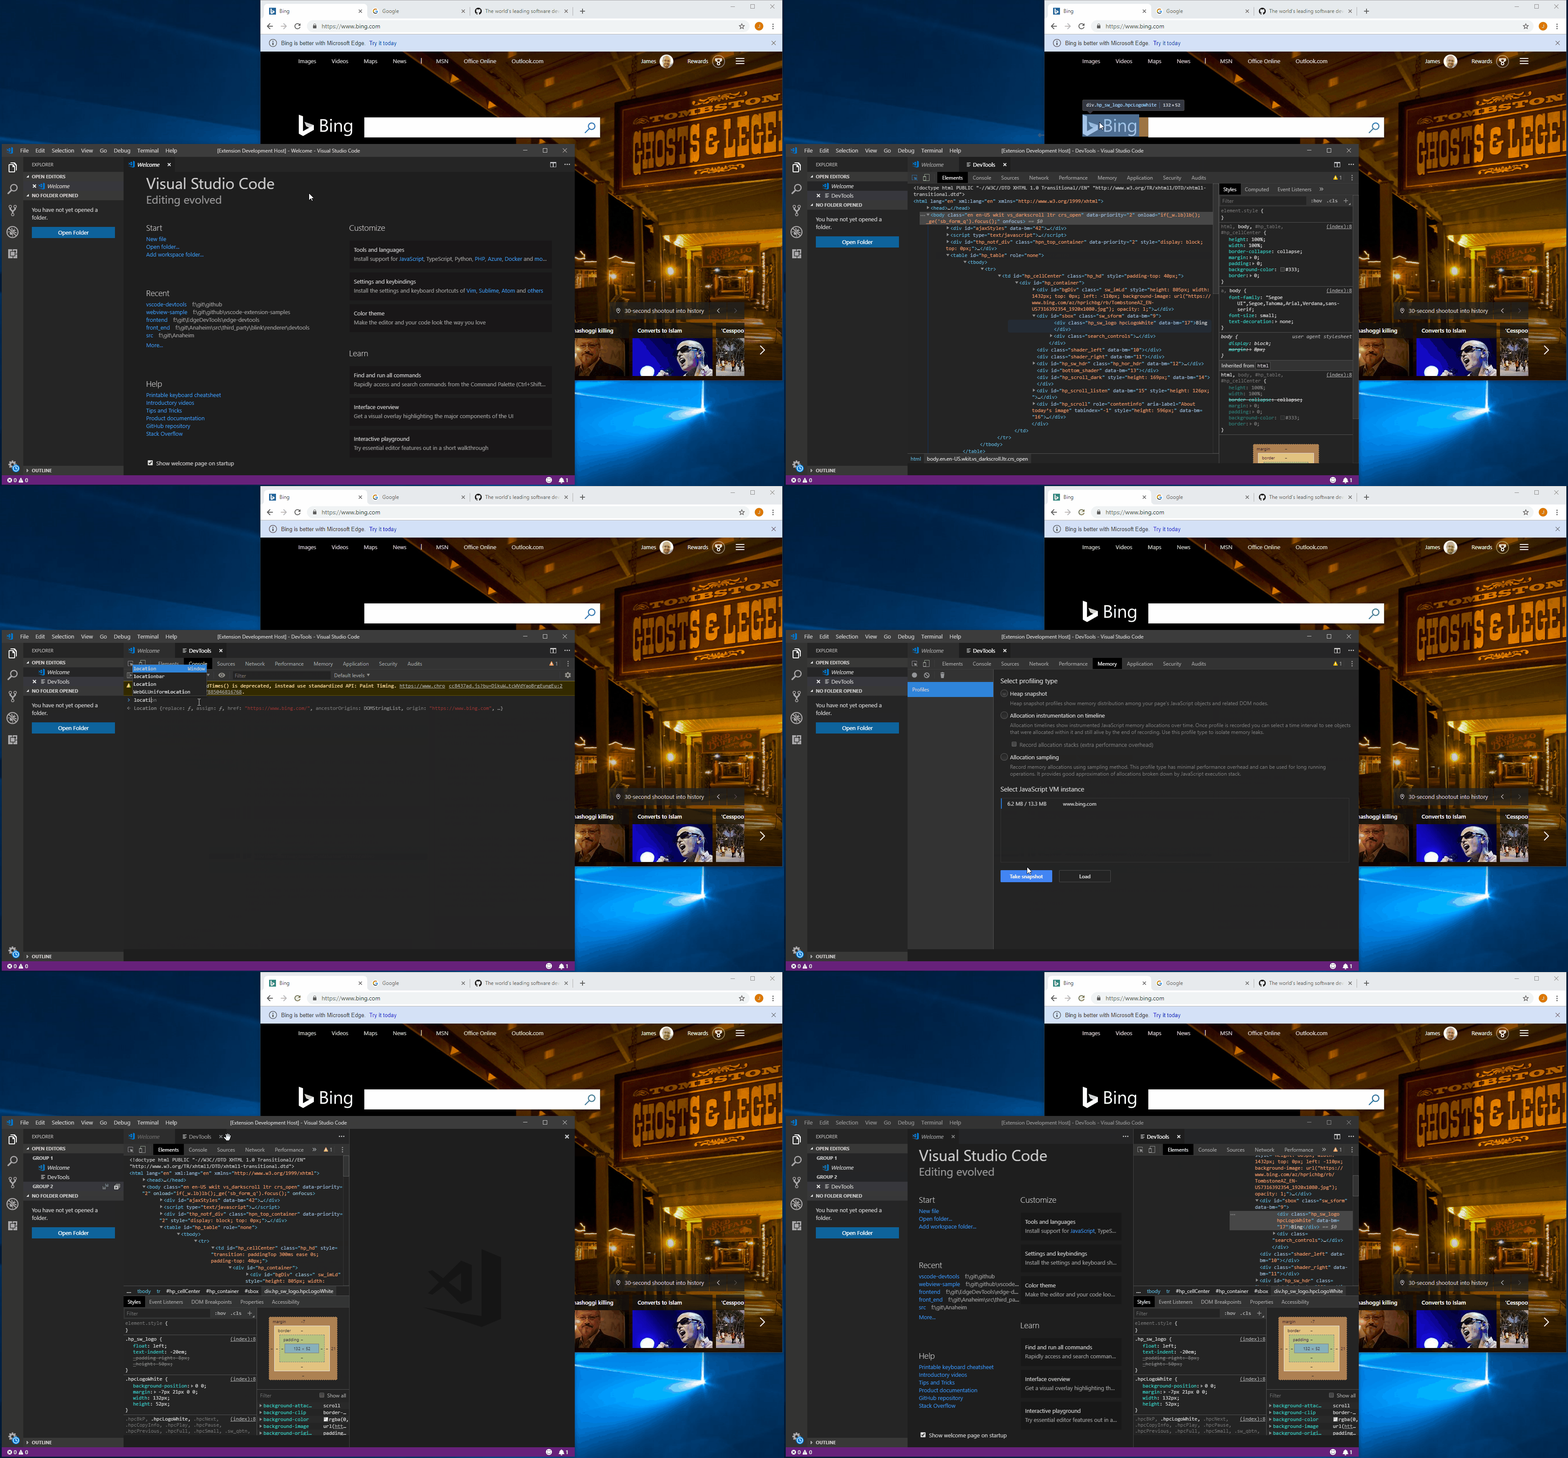
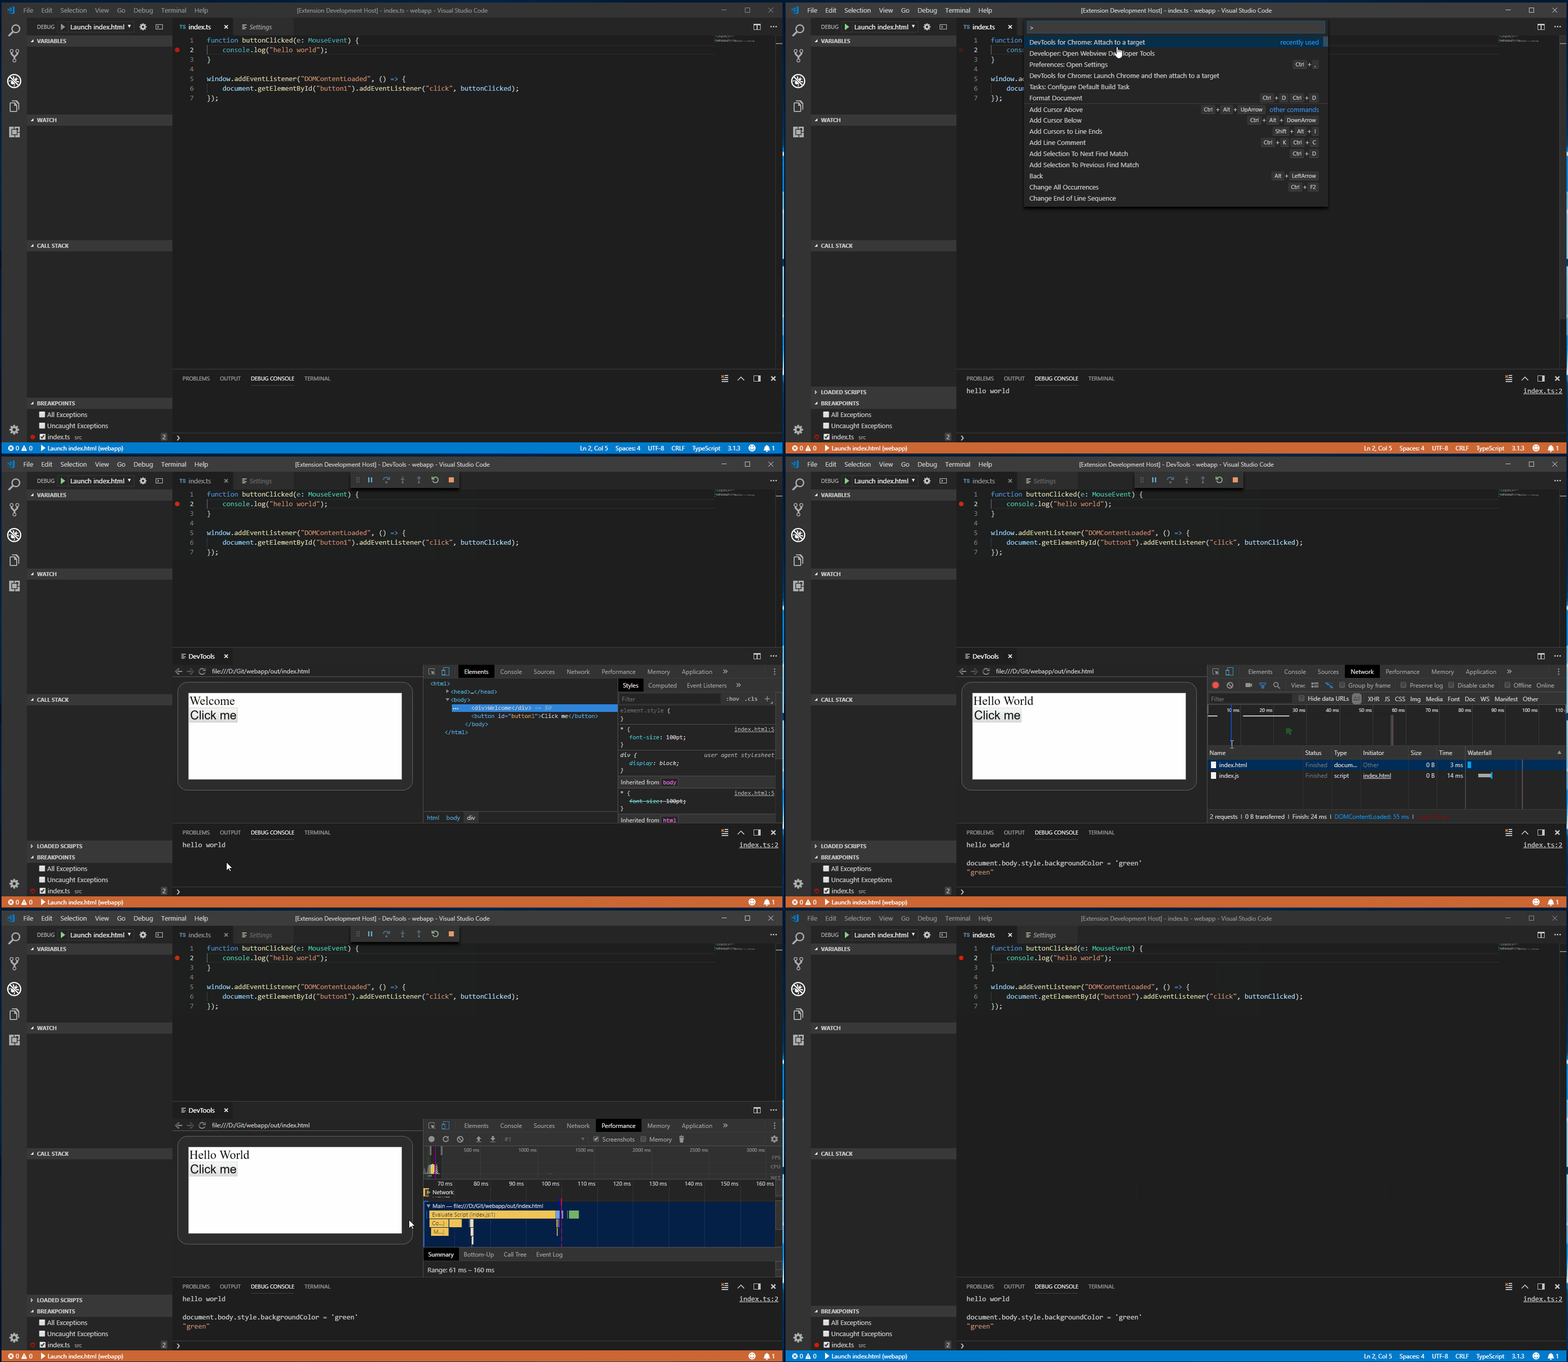
A VSCode extension to host the chrome devtools inside of a webview.
If you are looking for a more streamlined and officially supported devtools extension, you should try VS Code - Elements for Microsoft Edge (Chromium)
You can launch the Chrome DevTools hosted in VS Code like you would a debugger, by using a launch.json config file. However, the Chrome DevTools aren't a debugger and any breakpoints set in VS Code won't be hit, you can of course use the script debugger in Chrome DevTools.
To do this in your launch.json add a new debug config with two parameters.
type- The name of the debugger which must bedevtools-for-chrome. Required.url- The url to launch Chrome at. Optional.file- The local file path to launch Chrome at. Optional.request- Whether a new tab in Chrome should be openedlaunchor to use an exsisting tabattachmatched on URL. Optional.name- A friendly name to show in the VS Code UI. Required.
{
    "version": "0.1.0",
    "configurations": [
        {
            "type": "devtools-for-chrome",
            "request": "launch",
            "name": "Launch Chrome DevTools",
            "file": "${workspaceFolder}/index.html"
        },
        {
            "type": "devtools-for-chrome",
            "request": "attach",
            "name": "Attach Chrome DevTools",
            "url": "http://localhost:8000/"
        }
    ]
}
- Start chrome with no extensions and remote-debugging enabled on port 9222:
chrome.exe --disable-extensions --remote-debugging-port=9222
- Open the devtools inside VS Code:
- Run the command -
DevTools for Chrome: Attach to a target - Select a target from the drop down
- Run the command -
- Start chrome:
- Run the command -
DevTools for Chrome: Launch Chrome and then attach to a target - Navigate to whatever page you want
- Run the command -
- Open the devtools inside VS Code:
- Select a target from the drop down
- Prototyping stage
- Having the DevTools in a non-foreground tab can cause issues while debugging
- This is due to VS Code suspending script execution of non-foreground webviews
- The workaround is to put the DevTools in a split view tab so that they are always visible while open
- Chrome browser extensions can sometimes cause the webview to terminate
- Start chrome with remote-debugging enabled on port 9222
chrome.exe --disable-extensions --remote-debugging-port=9222
- Run the extension
npm installnpm run watchornpm run build- Open the folder in VSCode
F5to start debugging
- Open the devtools
- Run the command -
DevTools for Chrome: Attach to a target - Select a target from the drop down
- Run the command -

