A Flask-Matplotlib Tutorial
Hopefully this will walk you through integrating semi-responsive matplotlib charts in a small flask app using Python 3.6. Python2 was awesome but please stop using it. Install 3.6 and give f-strings a whirl, they are wonderful.
Background
There is a spectrum of responsive web plotting options that I am aware of, in the order of more Python/Flask to more Javascript:
- Static charts made on demand: Generate plots with Matplotlib and a URL (I don't know if this counts as responsive, it's kinda responsive). This is great if your plots are going to get fancier than lines, bars, and scatter plots and you don't want to add a bunch of JS overhead to your app.
- Dynamic charts that let you zoom and stuff: Vega-lite is the new grammar-of-graphics hottness and Python libraries like Altair and pdvega make it easy to use and give you all sorts of free cool features. They mostly focus on statistical plotting, so this might not be the one to pick for your
- I think Bokeh fits in about here. Bokeh is great if you have a lot of data and you want to stream it to the chart, there is more setup than vega because it creates servers and streams data.
- Responsive D3 plotting: D3 is great and really fun and creates pretty mind-blowing plots, but you're gonna be writing some JS. The enter-transform-exit model for updates is amazing.
- Fancy 3D WebGL: Three.js is amazing, but at this point you are basically building a 3D video game.
They are all good! It just depends on what you are trying to do. They can all work with any web framework, we're going to use Flask here.
This is based on this Full Stack Python Tutorial except more Matplotlib and less Bokeh.
Overview
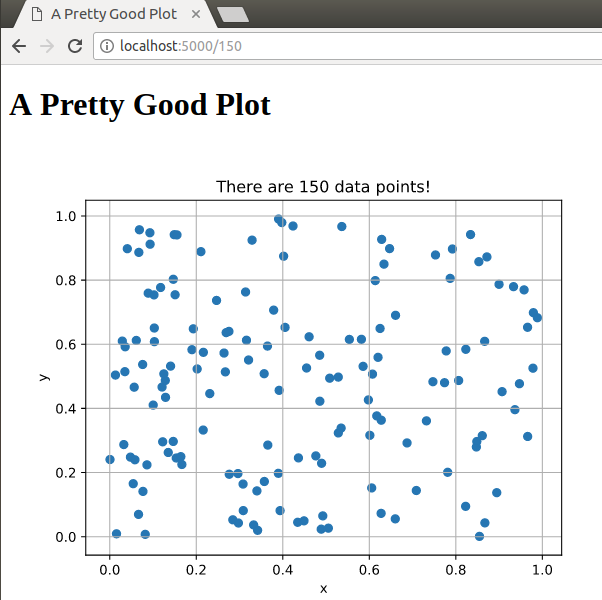
We are going to make an app in Flask that makes a chart based on URL data and serves it to the page.
Setting up a virtual environment
Set up a virtual environment for your app. I'm doing this on ubuntu 17.10 with Python 3.6.4, but it should work on OSX/Windows. You could use pipenv or pyenv or conda to do this too, but I'll stick with the built-in venv.
$ mkdir flask-matplotlib-tutorial
$ cd flask-matplotlib-tutorial
$ python3 -m venv env
$ source env/bin/activate
(env)$ pip install flask matplotlib numpy
Successfully installed Jinja2-2.10 MarkupSafe-1.0 Werkzeug-0.14.1 click-6.7 cycler-0.10.0 flask-0.12.2 itsdangerous-0.24 matplotlib-2.1.2 numpy-1.14.0 pyparsing-2.2.0 python-dateutil-2.6.1 pytz-2017.3 six-1.11.0
Setting up the app
setup.py
make a setup.py
$ pip install -e .
run.py
make a run.py
(env)$ python run.py
__init__.py
Creating a view
Plotting to svg
This is going to plot to svg, but we could plot to any image format like png or jpg.
Plotting
I recently discovered that f-strings and matplotlib labels/titles/annotations are pretty great.
Running the app
(env)$ python run.py
Navigate to http://localhost:5000/200 to see 200 data points! Change the number in the URL to see a different number of points.
