- Getting Your Code Into Jenkins
- Debugging A Container (Running On OpenShift)
- Watch The Logs
- Zipkin Instrumentation
To get the most of the Openshift client (oc-client) you need some tools available for Linux, if you are stuck with Windows you have two options:
-
One is to use the Linux virtualization via Windows WSL which is basically Linux user-space emulated by Windows System calls.
-
Your second option is to use Cmder which brings the Linux feeling to your Windows day-to-day and include tools such Cygwin (Gnu/Unix popular tools ported to Windows), Git, tar, etc.

Cmder UI
Once you have your Unix-like setup you need to get the oc-client, this will allow you to control Openshift from your command-line. You can get the binary for (Windows here or Linux) decompress and add it to your PATH:
# Linux
export PATH=$PATH:<your-decompressed-oc-client-folder-location>\

# Windows
set "PATH=%PATH%;<your-decompressed-oc-client-folder-location>\"This Java Spring Boot Project includes a pipeline installation script that will setup a quick and simple Jenkins Pipeline using Openshift in build pipeline strategy, before using it make sure you are logged in and inside your project:
#Login into Openshift
oc login
# Authentication required for ...

# Create a project
oc new-project <your-project>

# Go to your project
oc project <your-project>
Now you can create the pipeline like this:
oc create -f install.ymlThis will create a Openshift pipeline build which automatically do this:
- Creates (if there is none) an instance of Jenkins in your namespace/project.
- Creates a Job in this instance using the
Jenkinsfileincluded in the root directory of this project.
If there is a Jenkins already deployed in your in the namespace, it will reuse that one.
Once the pipeline is created it will create the Openshift components (BuildConfig, Deployment Configuration, Service and Router) to deploy your Spring Boot application.
This deployment is handle by yaml templates that defines the Openshift objects you need to deploy the Java SpringBoot application.
To keep the templates short and maintainable you can customize sections of the deployment using yaml patches.
The Jenkinsfile is the place that you should start customizing to fit your particular case.
- If something wrong happens while deploying (like
oc rollout latest) you can check the logs of the container by doing:
oc get pod | grep my-java-app
# my-java-app-1-build                 0/1       Completed   0          15m
# my-java-app-2-d6zs4                 1/1       Running     0          8m
We see here two container the one with suffix build means that this container was in charge of the building process (putting your JAR in place, configuration, etc.). The one with suffix d6zs4 (this is random) is the one holding your application, so if something is wrong at runtime you should look for the logs there, for example:
oc log my-java-app-2-d6zs4

log is DEPRECATED and will be removed in a future version. Use logs instead.
Starting the Java application using /opt/run-java/run-java.sh ...
exec java -javaagent:/opt/jolokia/jolokia.jar=config=/opt/jolokia/etc/jolokia.pro...
No access restrictor found, access to any MBean is allowed
Jolokia: Agent started with URL https://10.130.3.218:8778/jolokia/

  .   ____          _            __ _ _
 /\\ / ___'_ __ _ _(_)_ __  __ _ \ \ \ \
( ( )\___ | '_ | '_| | '_ \/ _` | \ \ \ \
 \\/  ___)| |_)| | | | | || (_| |  ) ) ) )
  '  |____| .__|_| |_|_| |_\__, | / / / /
 =========|_|==============|___/=/_/_/_/
:: Spring Boot :: (v2.2.2.RELEASE)If the pod is crashing continuously you won't have time to see the logs of the pod, in that case you can use the oc-debug command to revive crashed containers.
oc get pod | grep my-java-app
# my-java-app-1-build                0/1       Completed   0          15m
# my-java-app-2-x664                 1/1       Crash       0          8m
oc debug my-java-app-2-x664
# /bin/shThis will give you a temporary shell inside the container there you can try to execute manually the JAR and see reproduce the crashing behavior.
A typical problem with highly distributed systems is that they can be a pain to debug when something goes wrong. To help with this, I included in this project Spring Boot Sleuth which implement distributed tracing capabilities in a transparent way to the user.
In addition to Sleuth this project also includes Zipkin (Sleuth Adapter) which basically sends these traces to the Zipkin server. This server also includes a dashboard where you can monitor not only the activity of the services but also their dependencies.
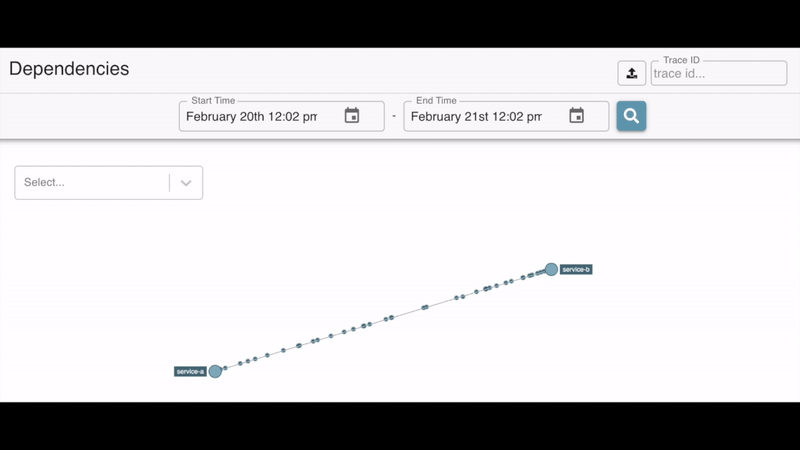
Watching dependencies between services
You can do some basic customization by editing the application.properties in your resource folder:
spring.zipkin.baseUrl = https://my-zipkin-server/
spring.sleuth.sampler.probability = 1
spring.sleuth.enabled = true

spring.application.name = hello-ping-1spring.zipkin.baseUrl- Is the URL for the Zipkin server, if you want to spin up your own you can read this guide.
sampler.probability- Here you can choose a value between 0 and 1, where
1tells sleuth to always send the traces and0will just logs the results to the console. For example0.5means that 50% percent of the time send the traces to the server.
- Here you can choose a value between 0 and 1, where
application.name- This the name that identify your service.
To see how this works you can deploy two services using the provided install.sh:
  sh jenkins\install.sh service-a https://github.com/cesarvr/Spring-Boot.git
  sh jenkins\install.sh service-b https://github.com/cesarvr/Spring-Boot.git
This will deploy two Spring Boot services
service-aandservice-b.
To test the instrumentation I have added to this project two additional endpoints:
/pingWhich make a call to another microservicepongendpoint (specified by the variablePONG_ENDPOINT) and append the response obtaining (hopefully)Ping! Pong!./pongWhich just returnsPong!

The idea is to create the
Ping! Pong!string by bouncing the calls between them.
Let's identify first the URL for each service using oc get route:
 oc get route
 # service-a   service-a.route.com    service-a   8080                      None
 # service-b   service-b.route.com    service-b   8080                      None
We setup the environment variable PONG_ENDPOINT to point to the /pong endpoint of the adjacent service:
 oc set env dc/service-b PONG_ENDPOINT=http://service-b.route.com/pong
 oc set env dc/service-a PONG_ENDPOINT=http://service-a.route.com/pong
Now we have the most resource intensive string concatenation in the world...
One thing that is not right yet is that both services share the same application.name meaning that they will look the same. To fix this (assuming that you are running this project locally) you just need to change this value in the properties file:
application.name = service-b # from service-aoc get bc
# NAME TYPE FROM LATEST
# service-a Source Binary 2
# service-b Source Binary 2
oc start-build bc/service-b --from-file=. --follow
oc rollout latest dc/service-bIn this case we changed the name to
service-band we rebuild the image again.
Generate some traffic:
curl http://service-b.route.com/ping
#Ping! Pong!
curl http://service-a.route.com/ping
#Ping! Pong!
curl http://service-b.route.com/ping
#Ping! Pong!
And now you can see your traces in the Zipkin dashboard:

Global view

Debugging a trace
That instance is a test one I have (ephemeral) at the moment if you want to deploy one yourself you can use this template
In reality Openshift uses an abstraction called pod whose purpose is to facilitate the deployment of one or many containers and made them behave as a single entity (or a single container). For more information about pods