Pi-Eon
##DHT22 Temperature and Humidity Sensor with the Raspberry Pi
###Introduction
Not another blog with a Pi and a temperature-humidity sensor you think. But wait, this is different. This includes Eon, which gives you the power to view those sensor readings in a beautiful graph that updates itself in real time; from anywhere in the world, and just a few lines of code. Who doesnt love a great visualization notifying you in real time!!? Real time dashboards, its happening!
https://vine.co/u/1223075210341806080 - GIF
There are 3 parts to this blog :
- The circuit to sense temperature and humidity.
- PubNub that lets you publish this value to a browser any where in the world.
- Eon that is a Javascript library that allows you to chart the data into a real time graph.
Lets not waste any more time and jump straight into it.
What does the sensor do?
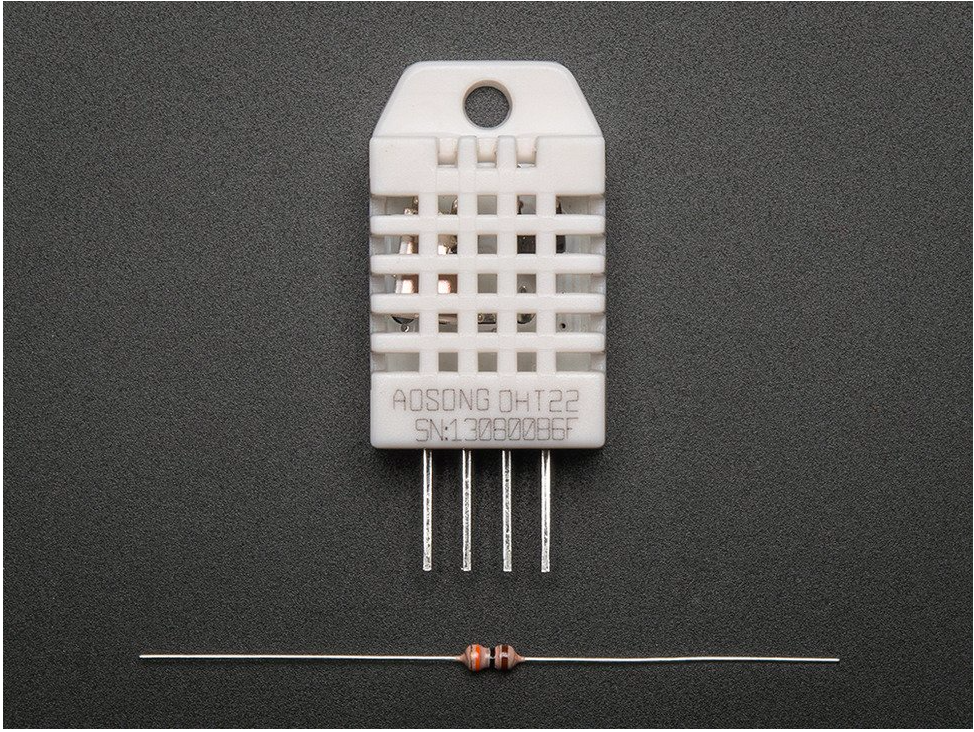
The DHT22 is a basic, low-cost digital temperature and humidity sensor. It uses a capacitive humidity sensor and a thermistor to measure the surrounding air, and spits out a digital signal on the data pin. Connect the first pin on the left to 3.3V power, the second pin to your data input pin and the right most pin to ground.
###Part 1: The Hardware Setup
What you will need
1.The DHT22 sensor
 2.3 jumper wires
3.Breadboard
4.4.7kΩ (or 10kΩ) resistor
5.Raspberry Pi 2 loaded with the Raspbian OS.
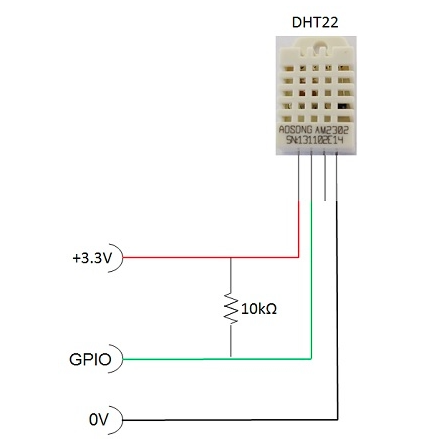
Set up the circuit according to the following figure:
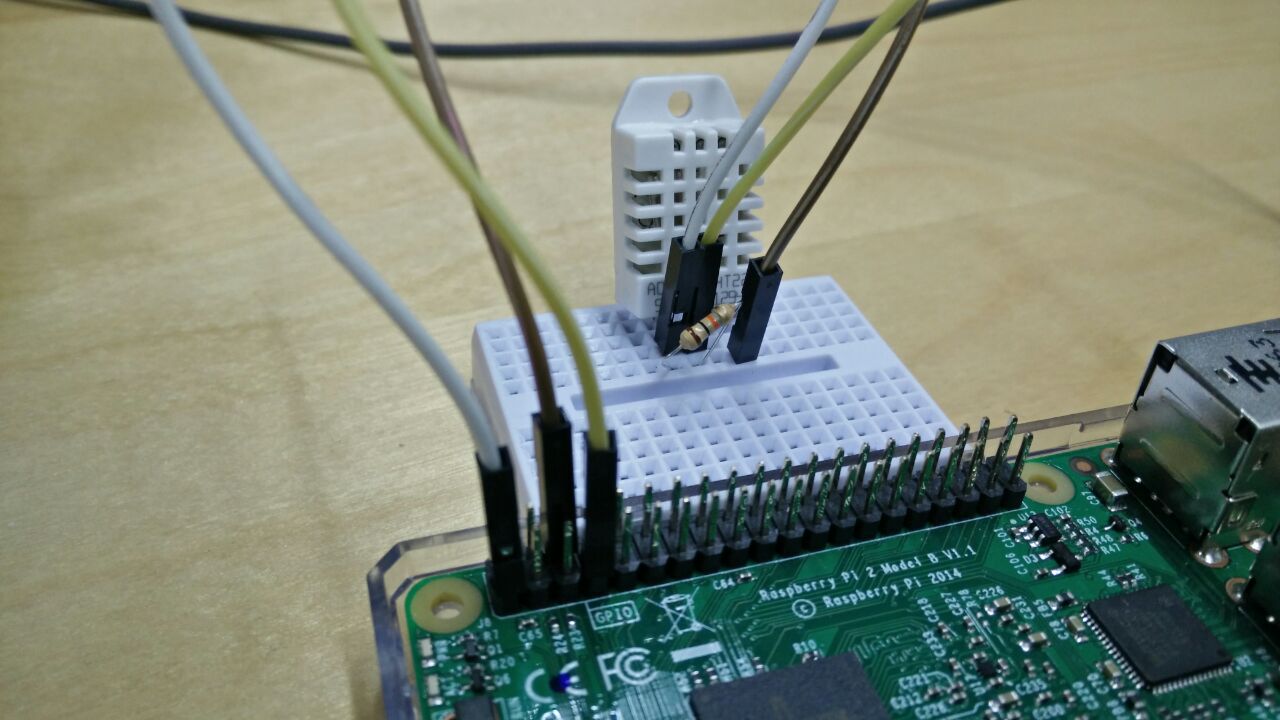
which translates to
I have connected to GPIO4 (pin7), pin 1 for the voltage (3v3) and pin 6 for ground. The resistor goes between the first two pins of the sensor. The third pin of the sensor need not be connected to anything.
###Part 2: Script to read the sensor values
Lets quickly go through the python script to see how to stream realtime temperature readings collected by the DHT22. In order to run PubNub on the Pi, you will have to run the following commands on your terminal.
Installing PubNub
Open LXTerminal, and download and install the followings:
Install Python:
pi@raspberrypi ~$ sudo apt-get install python-dev
Install pip:
pi@raspberrypi ~$ sudo apt-get install python-pip
install PubNub:
pi@raspberrypi ~$ sudo pip install pubnub
For an in depth introduction to the Pi and PubNub, check this blog by [Tomomi](ADD LINK TO HER BIO HERE)
Make sure you have signed up for PubNub to obtain your pub/sub keys.
We need to use Adafruits DHT library to be able to read the temperature values from the sensor.
The Python code to work with Adafruit's DHT sensors is available on Github.
Downloading the Adafruit DHT liibrary:
pi@raspberrypi ~$ git clone https://github.com/adafruit/Adafruit_Python_DHT.git
pi@raspberrypi ~$ cd Adafruit_Python_DHT
Code walk through
First we import the libraries required for this project. We then initialize a PubNub object and use the publish subscribe keys which you got while signing up.
	import os
	import time
	import sys
	from pubnub import Pubnub
	import Adafruit_DHT as dht
	pubnub = Pubnub(publish_key='demo', subscribe_key='demo')
The exciting part of the project
Using the read.retry method from the Adafruit_DHT library, we can obtain the temperature denoted by 't' and 'h' respectively.
The rest is just publishing these values in a way that Eon understands. We publish the temperaure on a channel called temp_eon and the humidity on hum_eon. This whole thing repeats till the program is terminated so this way you can get constant temperature and humidity readings.
PubNub lets you view these readings remotely and with Eon you can create beautiful real time graphs in a matter of minutes. In this example, I am plotting the temperature as a line graph, and the humidity on a gauge graph.
One thing to make sure is that the temperature and humidity readings are published to two different channels. In the next section I will show you how the temperature readings are plotted on to two different graphs.
def callback(message):
    print(message)

while True:
    h,t = dht.read_retry(dht.DHT22, 4)
    pubnub.publish('tempeon', {
        'columns': [
            ['x', time.time()],
            ['temperature_celcius', t]
            ]

        })
    pubnub.publish('humeon', {
        'columns': [
            ['humidity', h]
            ]

        })
You can find the entire code to run on your Pi on Github.
Realtime Graphs
At this point, if you are running the python script, open PubNub Developer Console and Debugger, put in the same keys and channel name used in the above python script, you will see the temperature readings on tempeon and humidity readings on the humeonchannel respectively.
Lets make the realtime graphs now!! For the temperature sensor line graph, open your favorite editor and paste this code. Save it, and open on a browser. There you have it, real time update of the temperature readings. To see the humidity readings as a gauge graph, paste this code.
temp-line.html: You are basically subscribing to the channel that you publish to, the type of graph you want, and specifying the types of axes you want.
eon.chart({
	history: true,
    channel: 'tempeon',
    flow: true,
    generate: {
    	bindto: '#chart',
    	data: {
      		x: 'x',
      		labels: false
    	},
    	axis : {
      		x : {
        		type : 'timeseries',
        		tick: {
          			format: '%H:%M:%S'
        		}
      		}
    	}
  	}
});
hum-gauge.html: I chose a gauge graph to represent the humidity values, and so the Eon script reflects this. You can choose various parameters like the min, max for the graph, the different thresholds and colors for each of them.
eon.chart({
	channel: 'humeon',
  	generate: {
    	bindto: '#chart',
    	data: {
     			type: 'gauge',
    	},
    	gauge: {
      		min: 0,
      		max: 100
    	},
    	color: {
      		pattern: ['#FF0000', '#F6C600', '#60B044'],
      		threshold: {
        	values: [30, 60, 90]
      	}
    }
  }
});
Project Eon provides very easy to understand code, that can be copy pasted. You can choose from different types of charts - Spline, Donut, Gauge and Bar chart. Visualization is always easier than seeing a bunch of text on the screen, and with Eon you just need a browser. Doesn't matter what you are working with - as long as the hardware, sensors, chips or mobile devices talks PubNub, you can publish to Eon and create great realtime dashboards.
What can you do with Project Eon?
Now you can collect data from countless devices and publish data in realtime to live-updating charts, maps and graphs. You can react immediately to the data that you are seeing. This data can be from several sensors, all on one graph, so you can see it in one place. You can also use it for vehicle location and state on a live-updating map. Or even financial data in a stock trading application. The possibilities are endless.
You can find detailed documentation at Project EON homepage or check out the Project EON GitHub repository.
Go EON"-ify" your next cool project.

