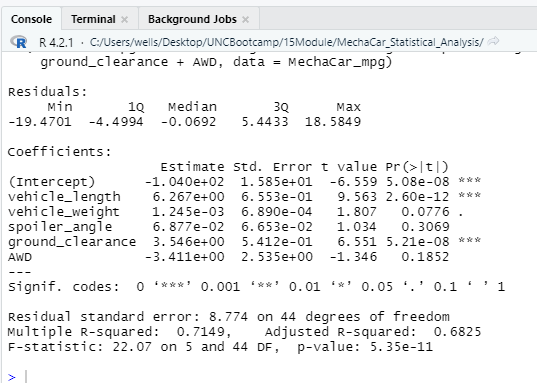
Which variables/coefficients provided a non-random amount of variance to the mpg values in the dataset?
Ground clearence, vehicle length, and the intercept provided a non-random amount of variance to the mpg values.
The p-value is small enough for us to conclued the the slope is not equal to 0.
The r-squared values indicate that this model is predictive of MechaCar prototypes.
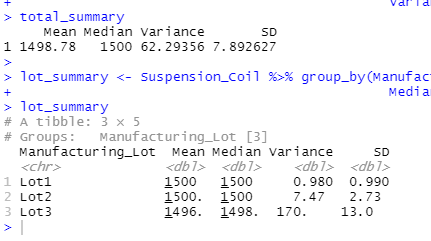
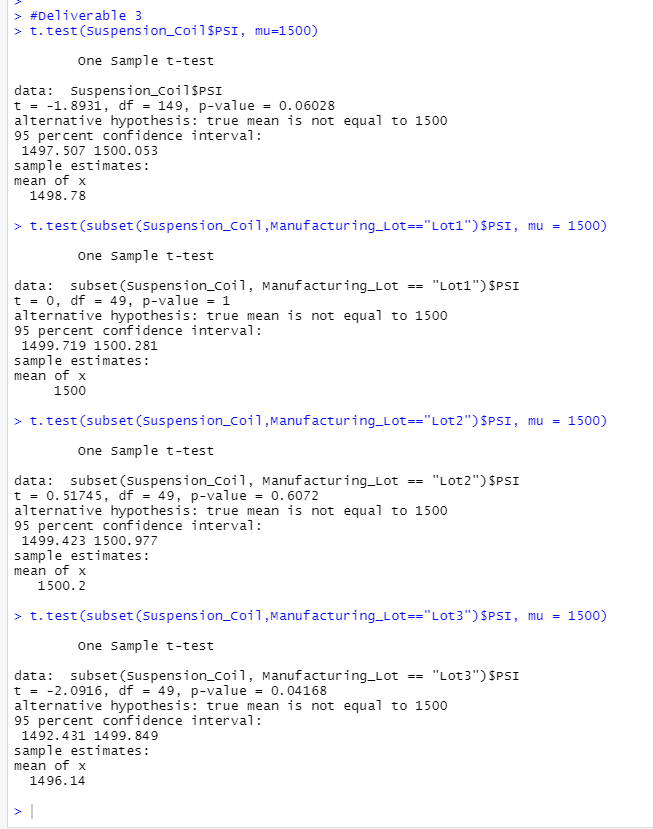
Does the current manufacturing data meet the design specification for all manufacturing lots in total and each lot individually? Why or why not?
The overal variance < 100 for all three lots taken together, but taken individually lot 3's variance is significantly higher.
The p-value is above .05 for Lot 1 and Lot 2, but it is a lower value for Lot 3.
- We will be measuring the relative safety of MechaCar's vehicles against its competition
- Our hypothesis may be that MechaCar's vehicles result in fewer accidents
- Our null hypothesis would be that there is no signficant difference between MechaCar and its competition.
- We could use linear regression to determine the amount of accidents each vehicle brand may be projected to be involved in.
- We would need traffic data. We could further refine the study by using data on MechCar's safety features and their competitions safety features to determine which feature contributes most signifcantly to overall safety.


