The purpose of this project was to determine which factors correlated to a successful Kickstarter campaign and make recommendations toward that goal. We are looking more specifically at Kickstarters aimed at theater campaigns by reviewing launch date and funding goals as the primary criteria.
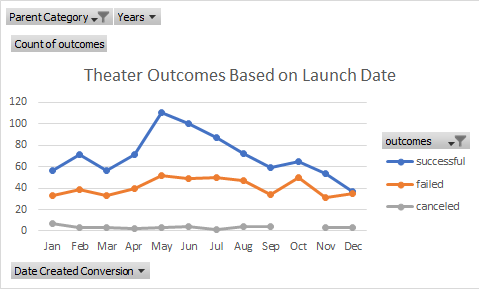
Reviewing outcomes of Kickstarters for theater projects by launch date indicates an upward trend in successful campaigns from March toward a peak in May, suggesting this may be the most auspicious timeframe in which to initiate a campaign. It is worth noting that unsuccessful campaigns also appear to increase in volume from March to May. However, the increase in successful campaigns commands a much more significant margin and a more dramatic rise. As indicated below, in May there were 111 successful theater Kickstarter campaigns to 52 failed and 3 cancelled campaigns. In other words, 67% of campaigns were successful in May. After this point, the number of successful campaigns declines until reaching the nadir in December.
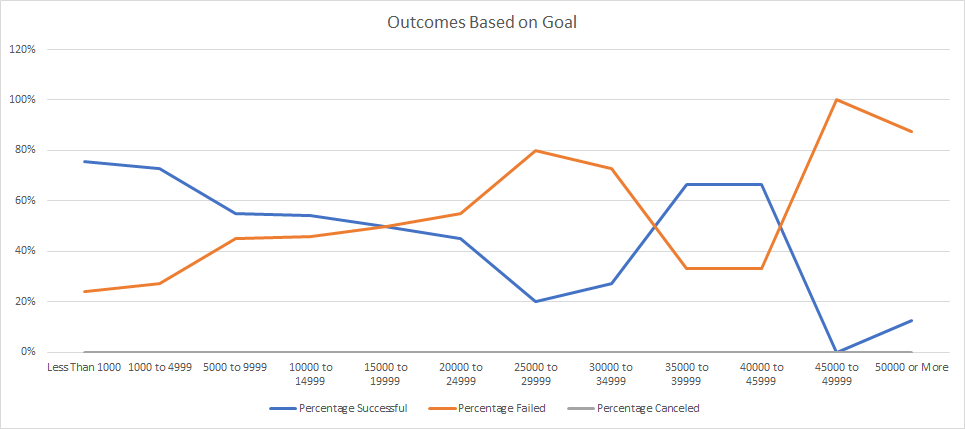
Reviewing outcomes based on goals initially indicates an inverse correlation between amount of funding requested and outcome: from the "Less than 1000" category through the "25000 to 29999" category, the higher the goal meets with an outcome that is less likely to be successful. At a goal of "Less than 1000," 76% of campaigns were successful. At a goal of "25000 to 29999," only 20% of campaigns are successful. From this point the rate of successful campaigns begins to rise again, remaining at 67% successful for campaigns seeking "35000 to 39999" and "40000 to 44999." The overall number of campaigns drops off, however, so while 67% are successful, this only translates to 6 campaigns and 3 campaigns, respectively. The ratio of successful to unsuccessful campaigns in general becomes less predictable after those seeking 15000 because the sample size shrinks significantly.
As indicated above, one of the challenges encountered was some inconsistency in the overall distribution of the data; in the Analysis of Outcomes Based on Goals, there are signficantly fewer campaigns requesting higher monetary goals. There are also other factors that could influence overall success rate, such as "Staff Picks" and "Spotlight" that may be worth considering.
Based on the distribution of the data, May would be the most opportune time to launch a Kickstarter, whereas launching a Kickstarter in December would have the least likely chance of success.
To aim for staying at or above 50% successful, requesting no more than 15000 is advised. To aim for staying at or above 70% successful, requesting no more than 5000 is advised.
One of the limitations of this data set is the distribution of data. As mentioned above, in the Analysis of Outcomes Based on Goals, there are signficantly fewer campaigns requesting higher monetary goals. Extending the timeframe of the data set might help in addressing this.
Future work might include creating visuals to that explore the influence of Staff Picks on successful projects using a pie chart. A box-and-whisker chart may prove useful for identifing outliers. A stacked bar chart might be a useful way to visualize instances in which the kickstarter projects procured more than the requested amount, grouping the data based on number of backers or financial goals.

