Exploratory Data Analysis Of Traffic Violations in USA(Maryland)
In this project, I have done analysis to get the insignts from Traffic Violations in USA using Pandas and Visualisation libraries like Matplotlib & Seaborn.
Dataset Info
data.shape
# Output : (1018634, 35)
The dataset is having 35 columns and over 1 million observations.
The Following table summarises the data that each column stores.
| # | Column Name | Description |
|---|---|---|
| 1 | Date Of Stop | Date of the traffic violation. |
| 2 | Time Of Stop | Time of the traffic violation. |
| 3 | Agency | Agency issuing the traffic violation. (Example: MCP is Montgomery County Police) |
| 4 | SubAgency | Court code representing the district of assignment of the officer. |
| 5 | Description | Text description of the specific charge. |
| 6 | Location | Location of the violation, usually an address or intersection. |
| 7 | Latitude | Latitude location of the traffic violation. |
| 8 | Longitude | Longitude location of the traffic violation. |
| 9 | Accident | YES if traffic violation involved an accident. |
| 10 | Belts | YES if seat belts were in use in accident cases. |
| 11 | Personal Injury | Yes if traffic violation involved Personal Injury. |
| 12 | Property Damage | Yes if traffic violation involved Property Damage. |
| 13 | Fatal | Yes if traffic violation involved a fatality. |
| 14 | Commercial License | Yes if driver holds a Commercial Drivers License |
| 15 | HAZMAT | Yes if the traffic violation involved hazardous materials. |
| 16 | Commercial Vehicle | Yes if the vehicle committing the traffic violation is a commercial vehicle. |
| 17 | Alcohol | Yes if the traffic violation included an alcohol related suspension. |
| 18 | Work Zone | Yes if the traffic violation was in a work zone. |
| 19 | State | State issuing the vehicle registration. |
| 20 | VehicleType | Type of vehicle (Examples: Automobile, Station Wagon, Heavy Duty Truck, etc.) |
| 21 | Year | Year vehicle was made. |
| 22 | Make | Manufacturer of the vehicle (Examples: Ford, Chevy, Honda, Toyota, etc.) |
| 23 | Model | Model of the vehicle. |
| 24 | Color | Color of the vehicle. |
| 25 | Violation Type | Violation type. (Examples: Warning, Citation, SERO) |
| 26 | Charge | Numeric code for the specific charge. |
| 27 | Article | Article of State Law. (TA = Transportation Article, MR = Maryland Rules) |
| 28 | Contributed To Accident | If the traffic violation was a contributing factor in an accident. |
| 29 | Race | Race of the driver. (Example: Asian, Black, White, Other, etc.) |
| 30 | Gender | Gender of the driver (F = Female, M = Male) |
| 31 | Driver City | City of the driver’s home address. |
| 32 | Driver State | State of the driver’s home address. |
| 33 | DL State | State issuing the Driver’s License. |
| 34 | Arrest Type | Type of Arrest (A = Marked, B = Unmarked, etc.) |
| 35 | Geolocation | Geo-coded location information. |
Missing Values
There are missing values in some columns, let's see the missing value percentages in the columns.
Column Name     % of Missing
-----------     ------------
Geolocation     8.347944
Longitude       8.347944
Latitude        8.347944
Article         5.111257
Color           1.334238
Year            0.630845
DL State        0.091201
Model           0.016591
Driver City     0.013842
State           0.005792
Make            0.004712
Driver State    0.001080
Description     0.000884
Location        0.000196
14 columns out of 35 are having missing values. The missing values in geolocation, longitude and latitude are same because the values in geolocation are just tuple of (latitude, longitude).
We will not drop these values now as we need to understand the data prior dropping them.
Data Visualization
I have used Seaborn and Matplot lib for visualizing each feature and also verified impact of one feature on others.
The data set has violation data from 2012 - 2016.
Violation Type
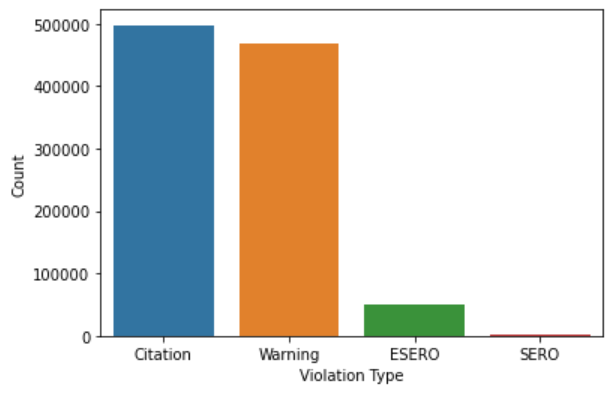
Around 90% of violations are Citations and Warning, rest are ESERO & SERO.
Violation Per Month:
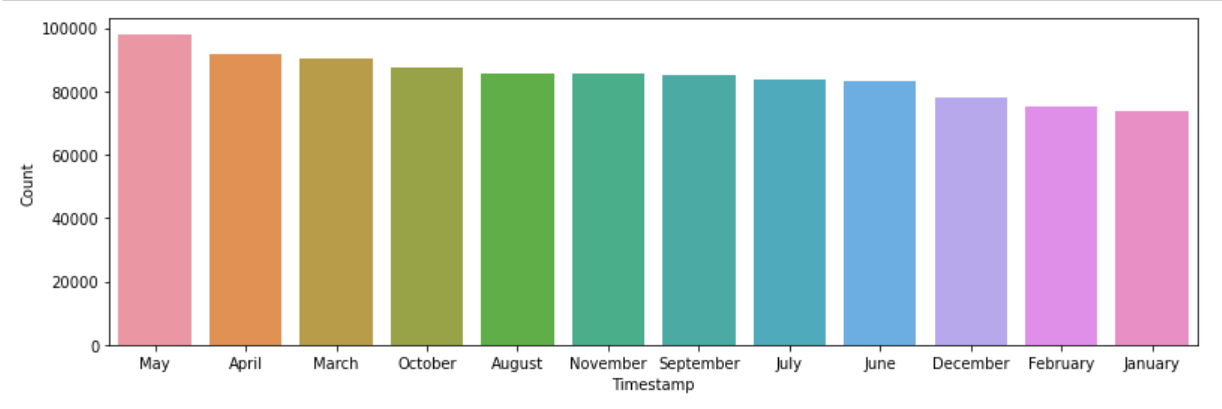
More Number of Violations happened in the middle of the year i.e., around May and Comparatively less number of violations happened in the start and end of year i.e., Jan, Feb & Dec.
Violations Per Week:
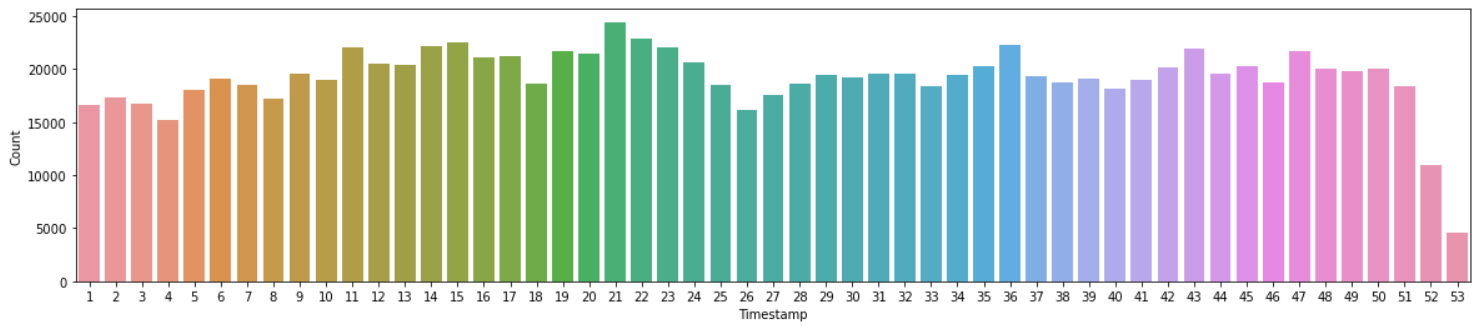
We can see that very less number of violations happened in the last weeks (52 & 53) of year.
Violations Per Hour:
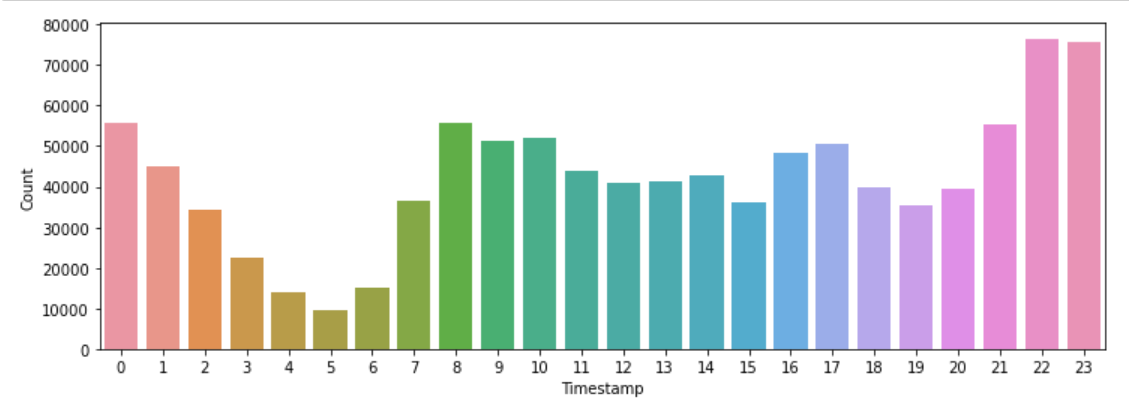
Highest Number of traffic voilations are happened in the mid of night, and very few violations happened in the early morning. This is because of traffic flow will be minimum in early mornings and high in the late evenings.
Description of Violation
The violation description is a text field, which contains the cause of violation in words. I have used Word Cloud for analyising most frequent words in the text.
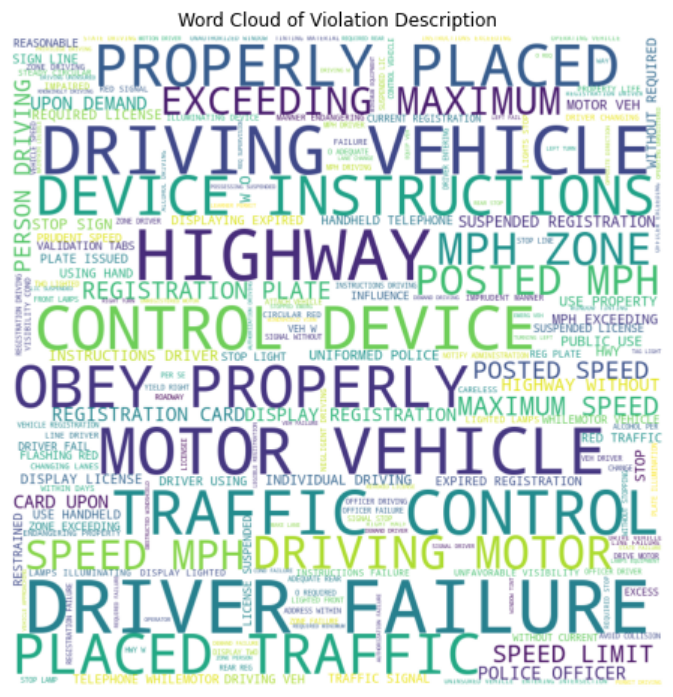
Most frequent words are having grater font size than less frequent words in the word cloud.
We can see most frequent words are Highway, Exceeding Maximum speed, so most traffic violations are related to speed limit and also highway related.
Driver Gender
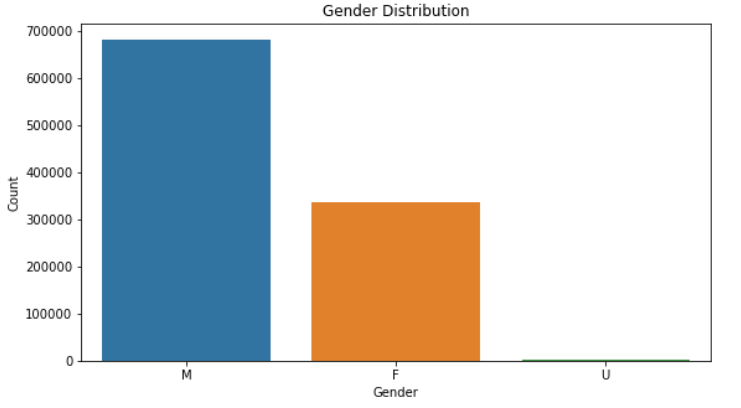
There are 3 unique values in Gender variable, the value U means undefined (Which are very less in number). Famale drivers are almost half of Male drivers who committed traffic violation.
Driver Race
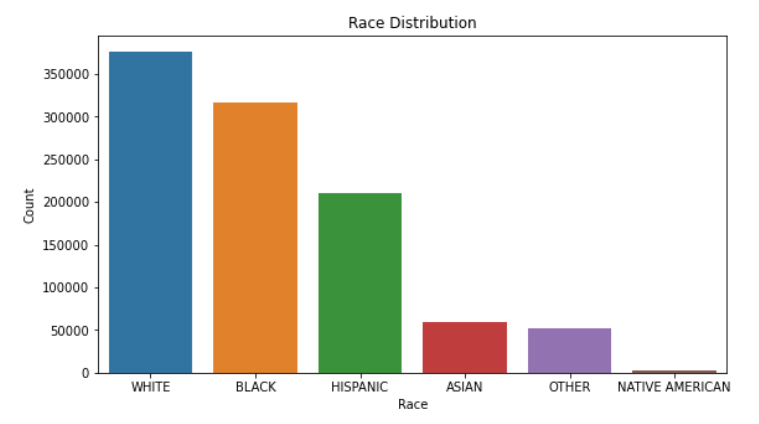
We have 5 main races and others for all the other races.
Highest drivers are White and Black people followed by hispanic and asian. The population also follows the same pattern.
Vehicle Maker
As there are allot of unique values in Vehicle Make Feature, I have used Word Cloud instead of bar plots to see their frequency in violations.
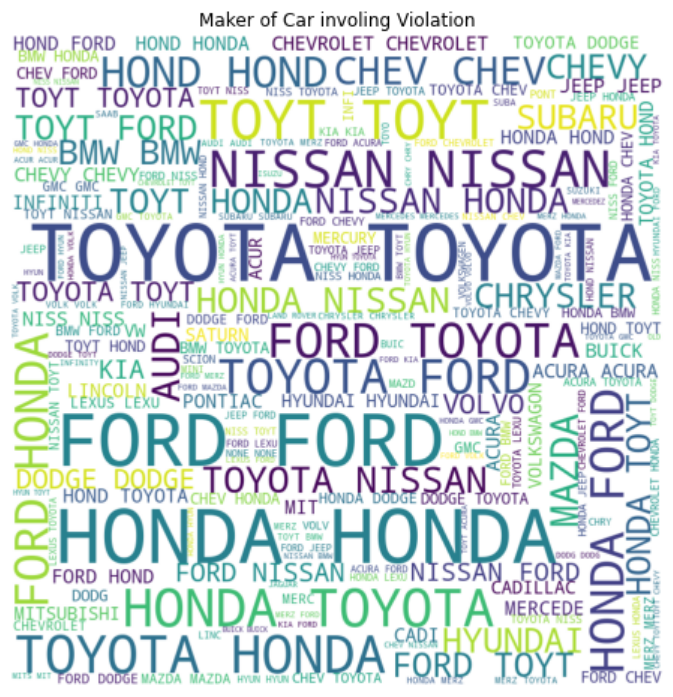
We can see the Toyota, Honda, Ford are most frequent in violations. Also we can see some data issue for Toyota, where in some places it is mentioned TOYT.
Vehicle Registered State
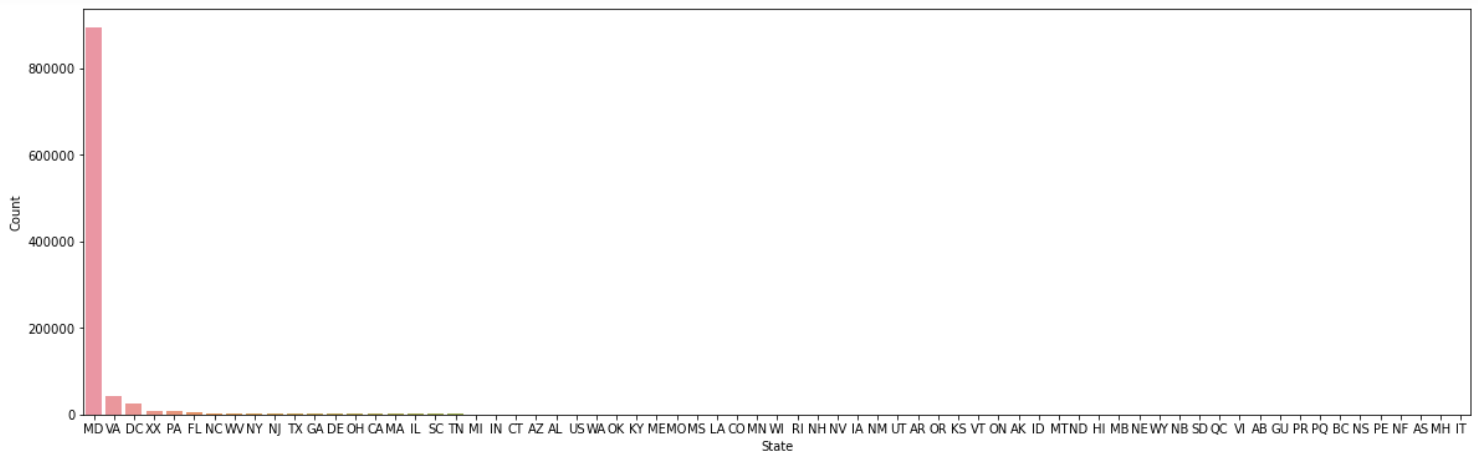
Over 85% Violations Vehicles are registered in Maryland only, because the data set is taken from Maryland MCP agency.
Correlation
We have 80% of variables are Categorical/Text type. In order to find correlation I have converted them into on-hot encoded fields.
By using the pearsons correlation on pandas data frame, and plotting them using a heatmap in seaborn gave following result.
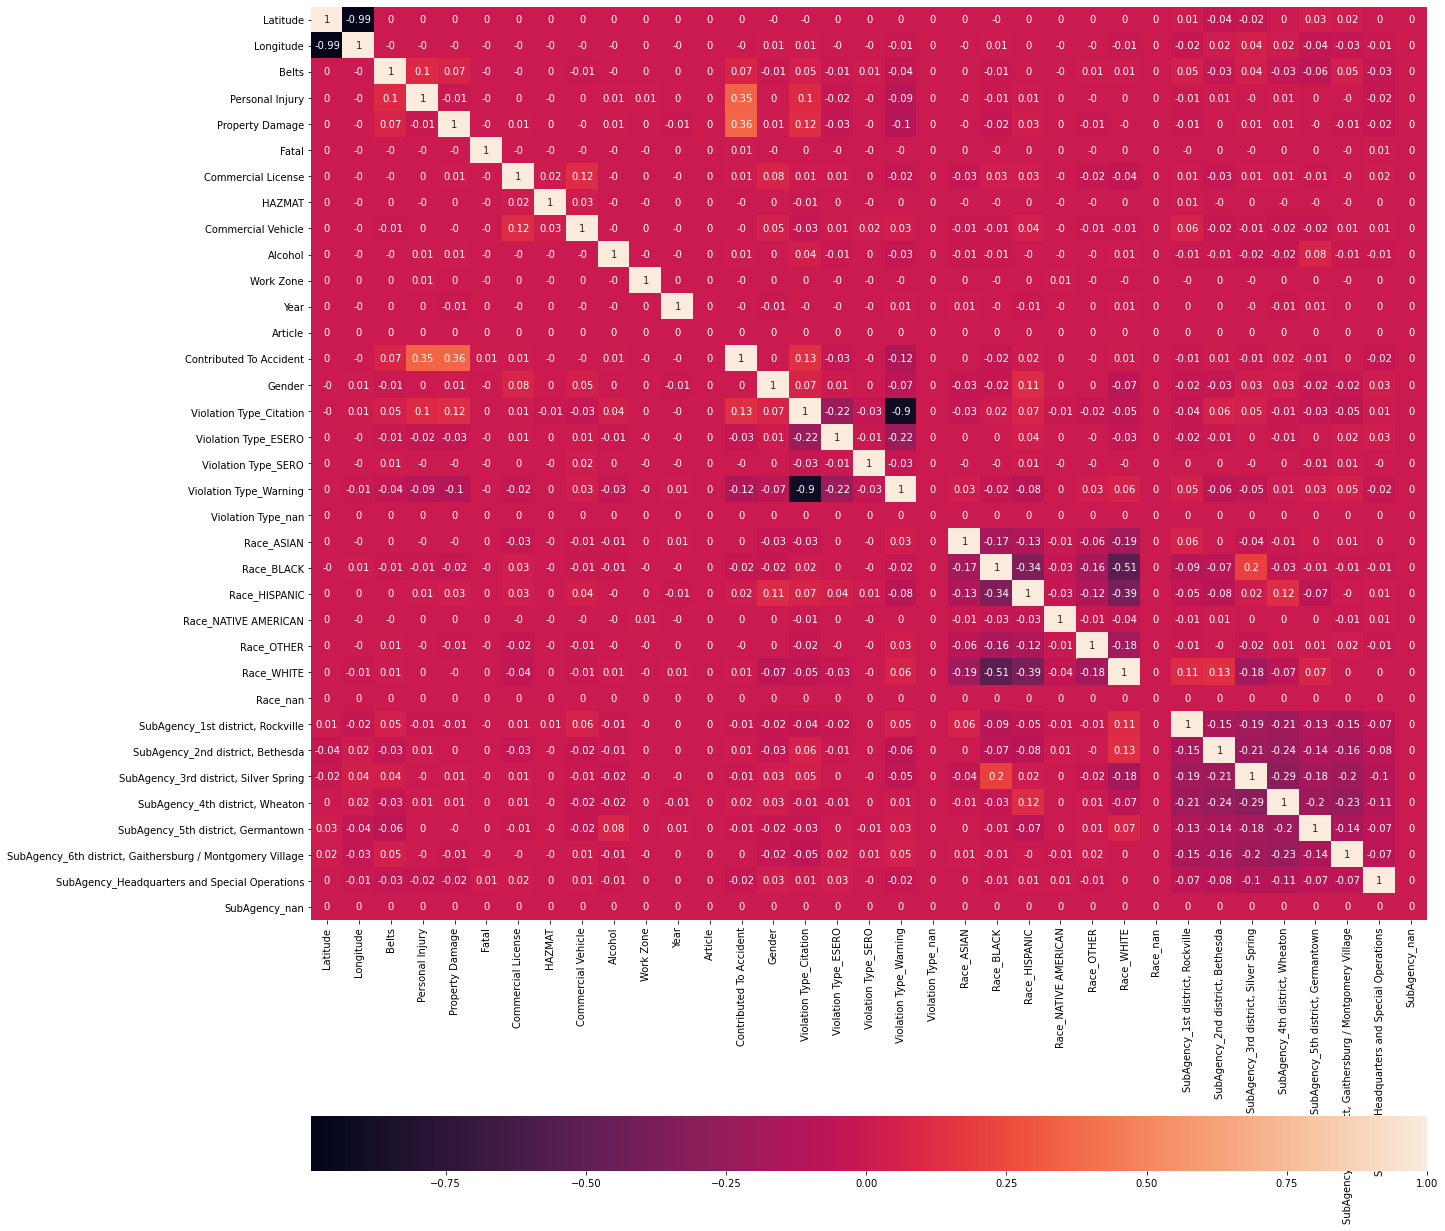
We can see there is almost no correlation between the variables. There is only a small positive correlation between Contributed to Accedent to Personal Injury and Property Damage.
Results
After performing the various visulazation techniques the following conclusions/findings has been done.
- Data set is having traffic violations from 2012 to 2016.
- Data set is from MCP Agency from Maryland.
- Highest Number of Violations happened in the mid night and very less happened in the early mornings.
- Most of the violations are related to speed and high way related.
- Most of the columns has sparse data.
- Citation and Warning Violation types are more than 95%.
- There is hardly no correlation between the columns. Only Contributed to Accident is correlated to Personal Injury & Property Damage.
The python notebook contains all the detailed visualisation of each and every column and also the bivariate analysis