Note: For the screenshots, you can store all of your answer images in the answer-img directory.
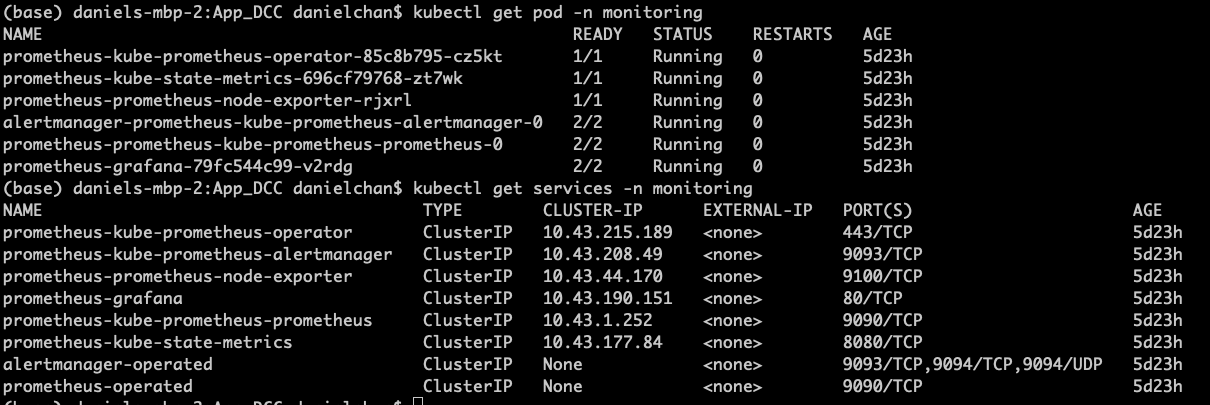
TODO: run kubectl command to show the running pods and services for the three components. Copy and paste the output or take a screenshot of the output and include it here to verify the installation
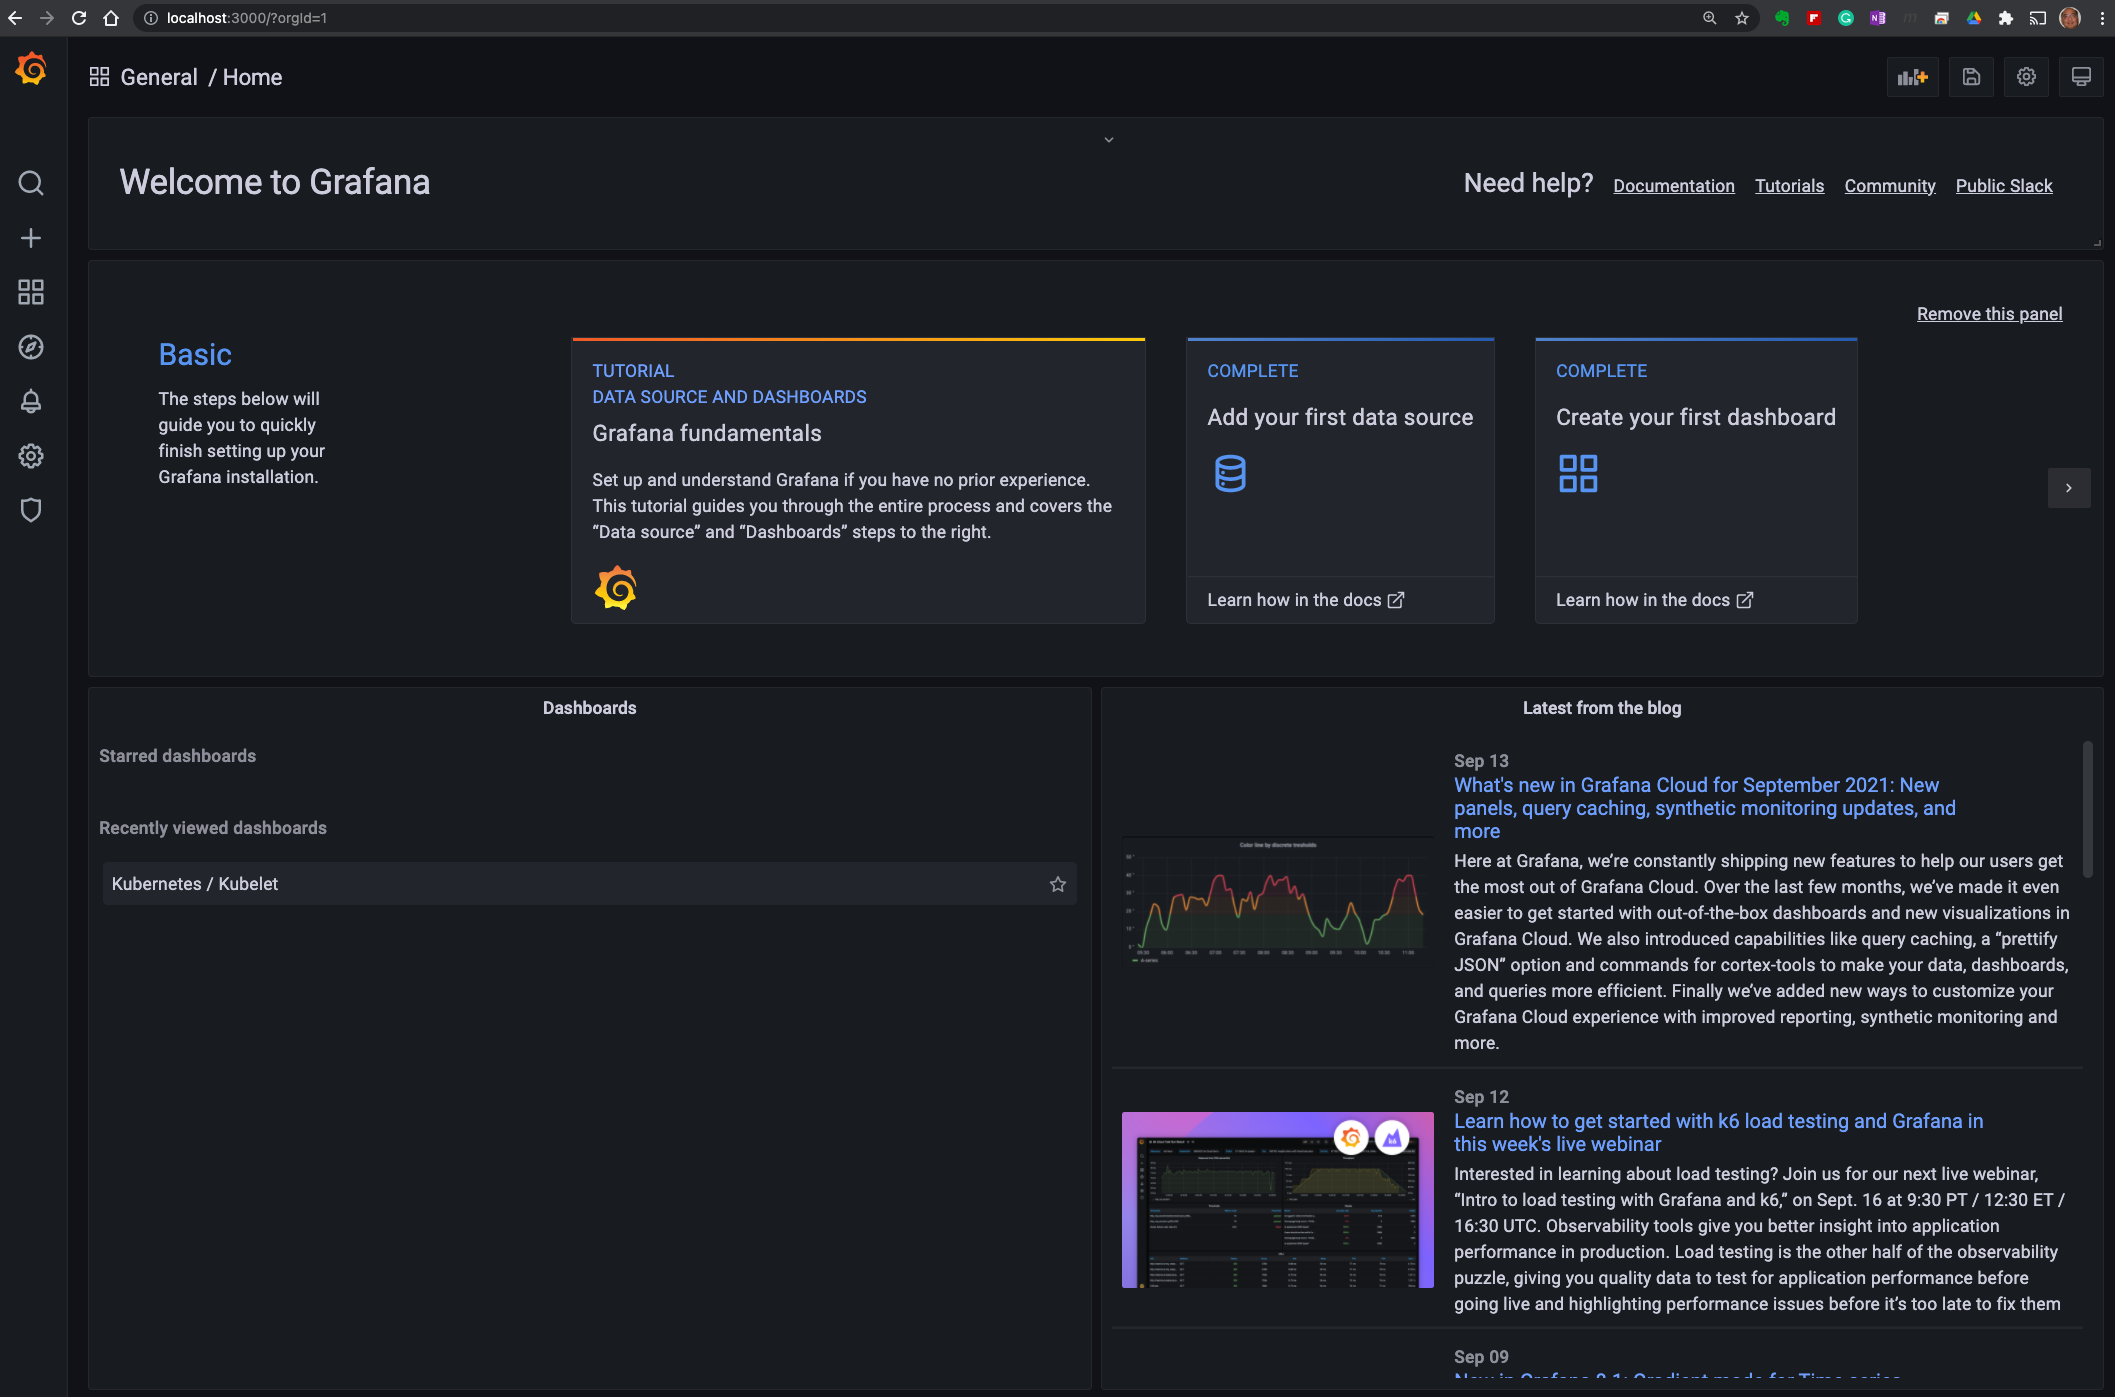
TODO: Expose Grafana to the internet and then setup Prometheus as a data source. Provide a screenshot of the home page after logging into Grafana.
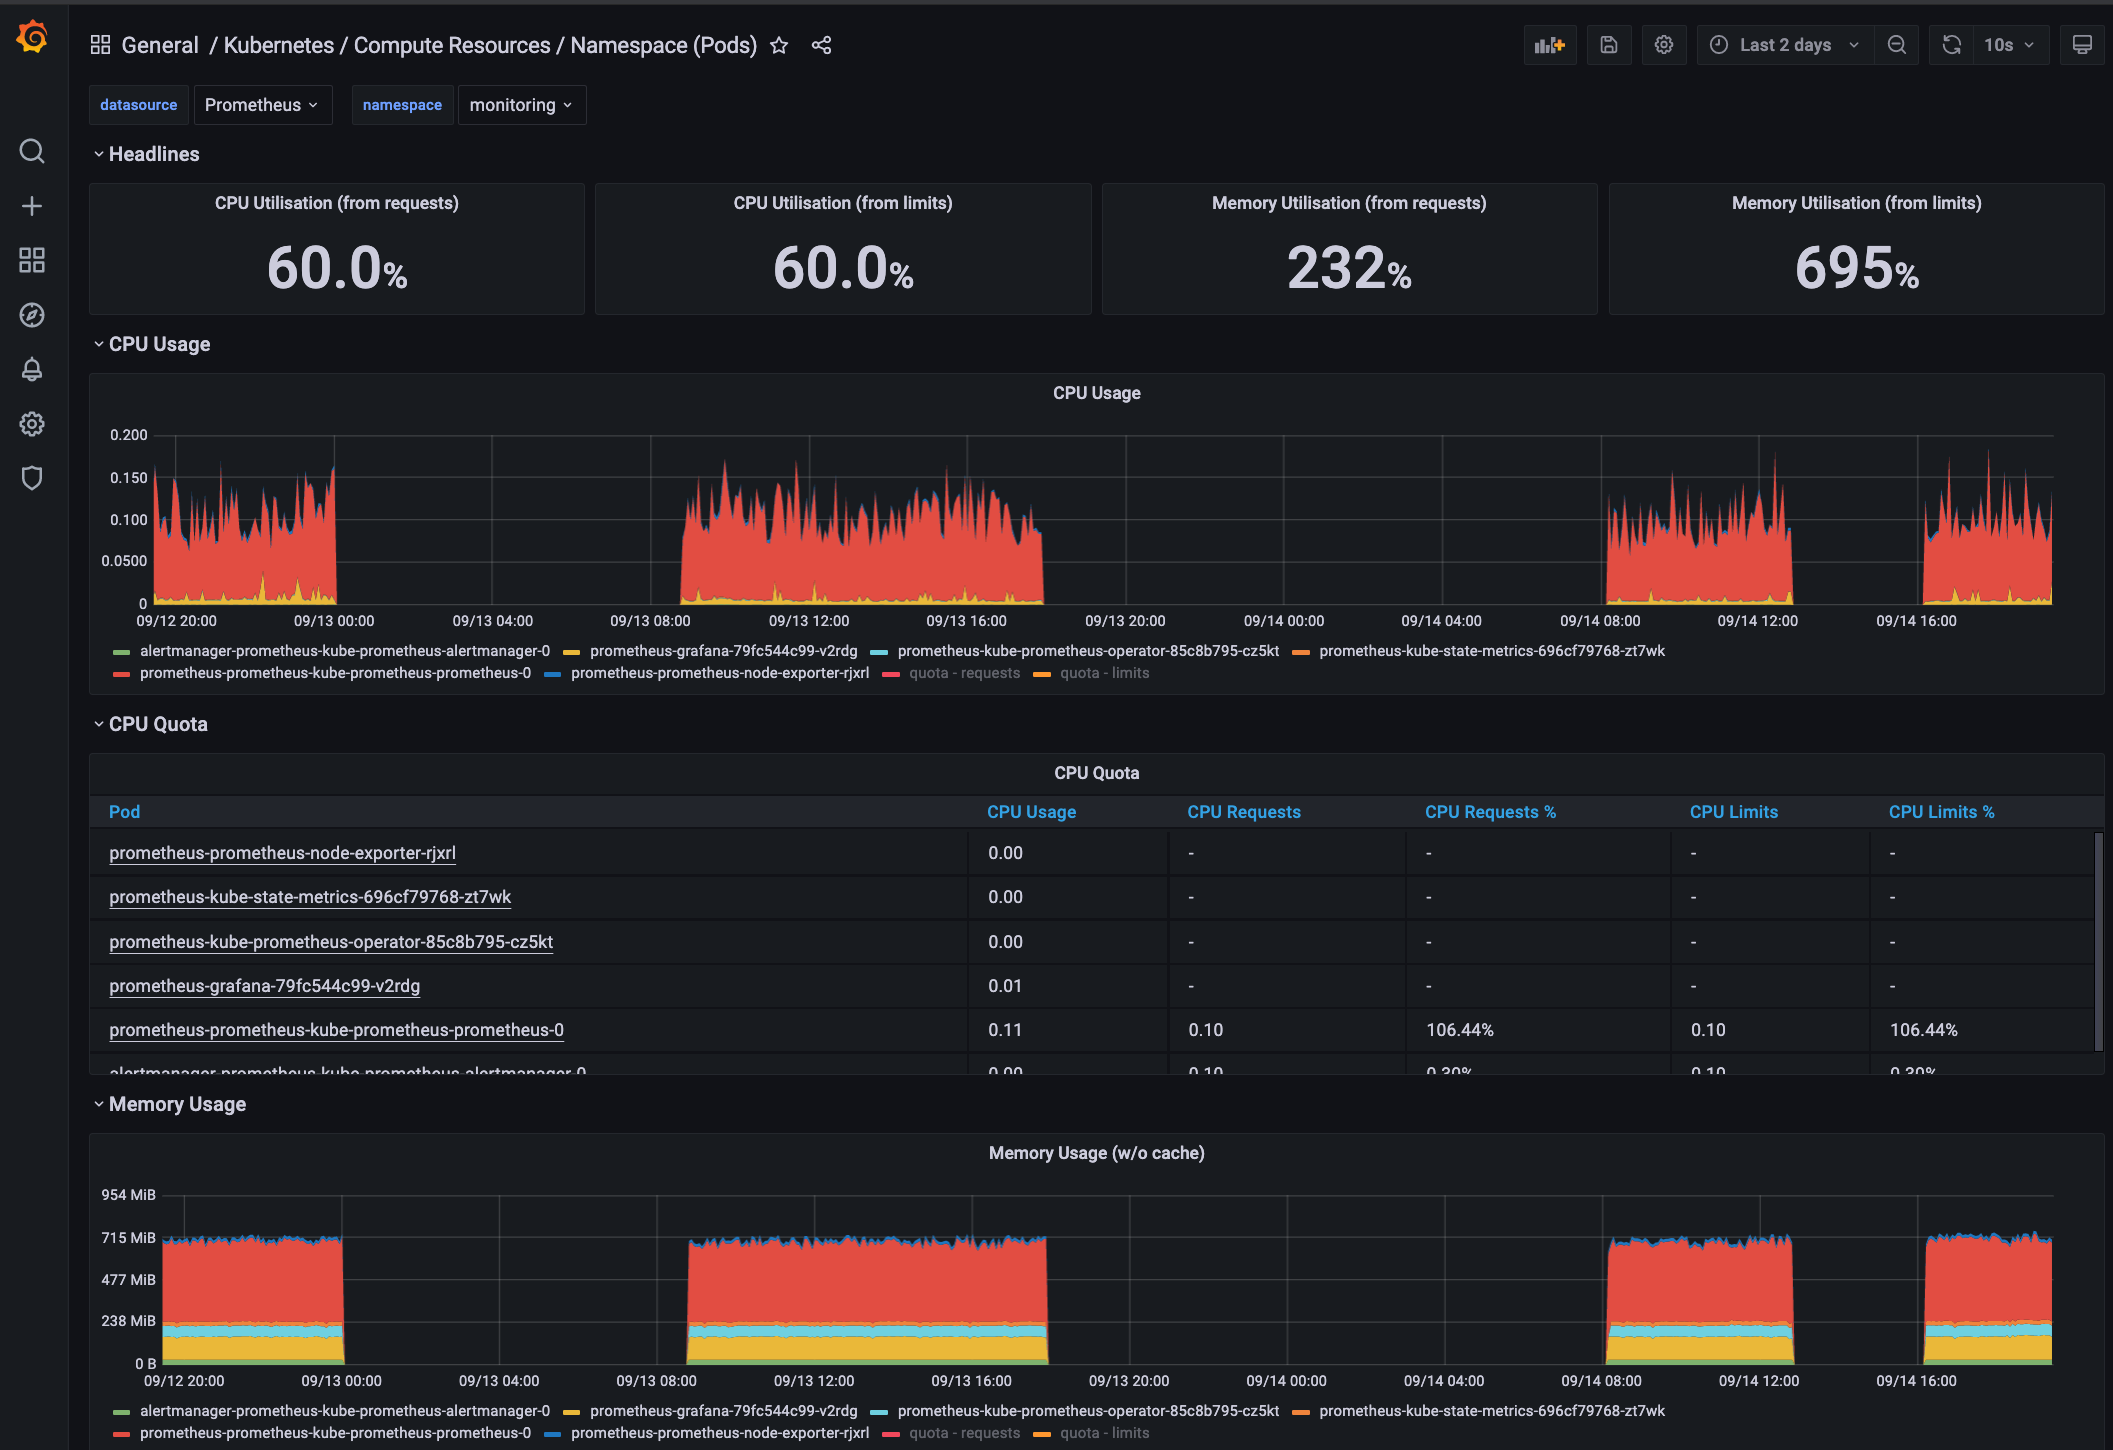
TODO: Create a dashboard in Grafana that shows Prometheus as a source. Take a screenshot and include it here.
TODO: Describe, in your own words, what the SLIs are, based on an SLO of monthly uptime and request response time.
SLIs are a defined set of measurements that we can use to demonstrate the SLO is met. For an SLO of monthly uptime and request response time, I would use SLIs such as:
- percentage of infrastructure uptime in a month.
- percentage of request response time that is less than 250 milliseconds in a month.
- percentage of CPU and memory consumption.
TODO: It is important to know why we want to measure certain metrics for our customer. Describe in detail 5 metrics to measure these SLIs.
I would follow the "4 Golden Signals" guideline and system uptime:
- Latency — The time taken to serve a request (usually measured in ms).
- Traffic — The amount of stress on a system from demand (such as the number of HTTP requests/second).
- Errors — The number of requests that are failing (such as number of HTTP 500 responses).
- Saturation — The overall capacity of a service (such as the percentage of memory or CPU used).
- Uptime — The percentage of system availability during a defined period (such as 1 day or 1 month).
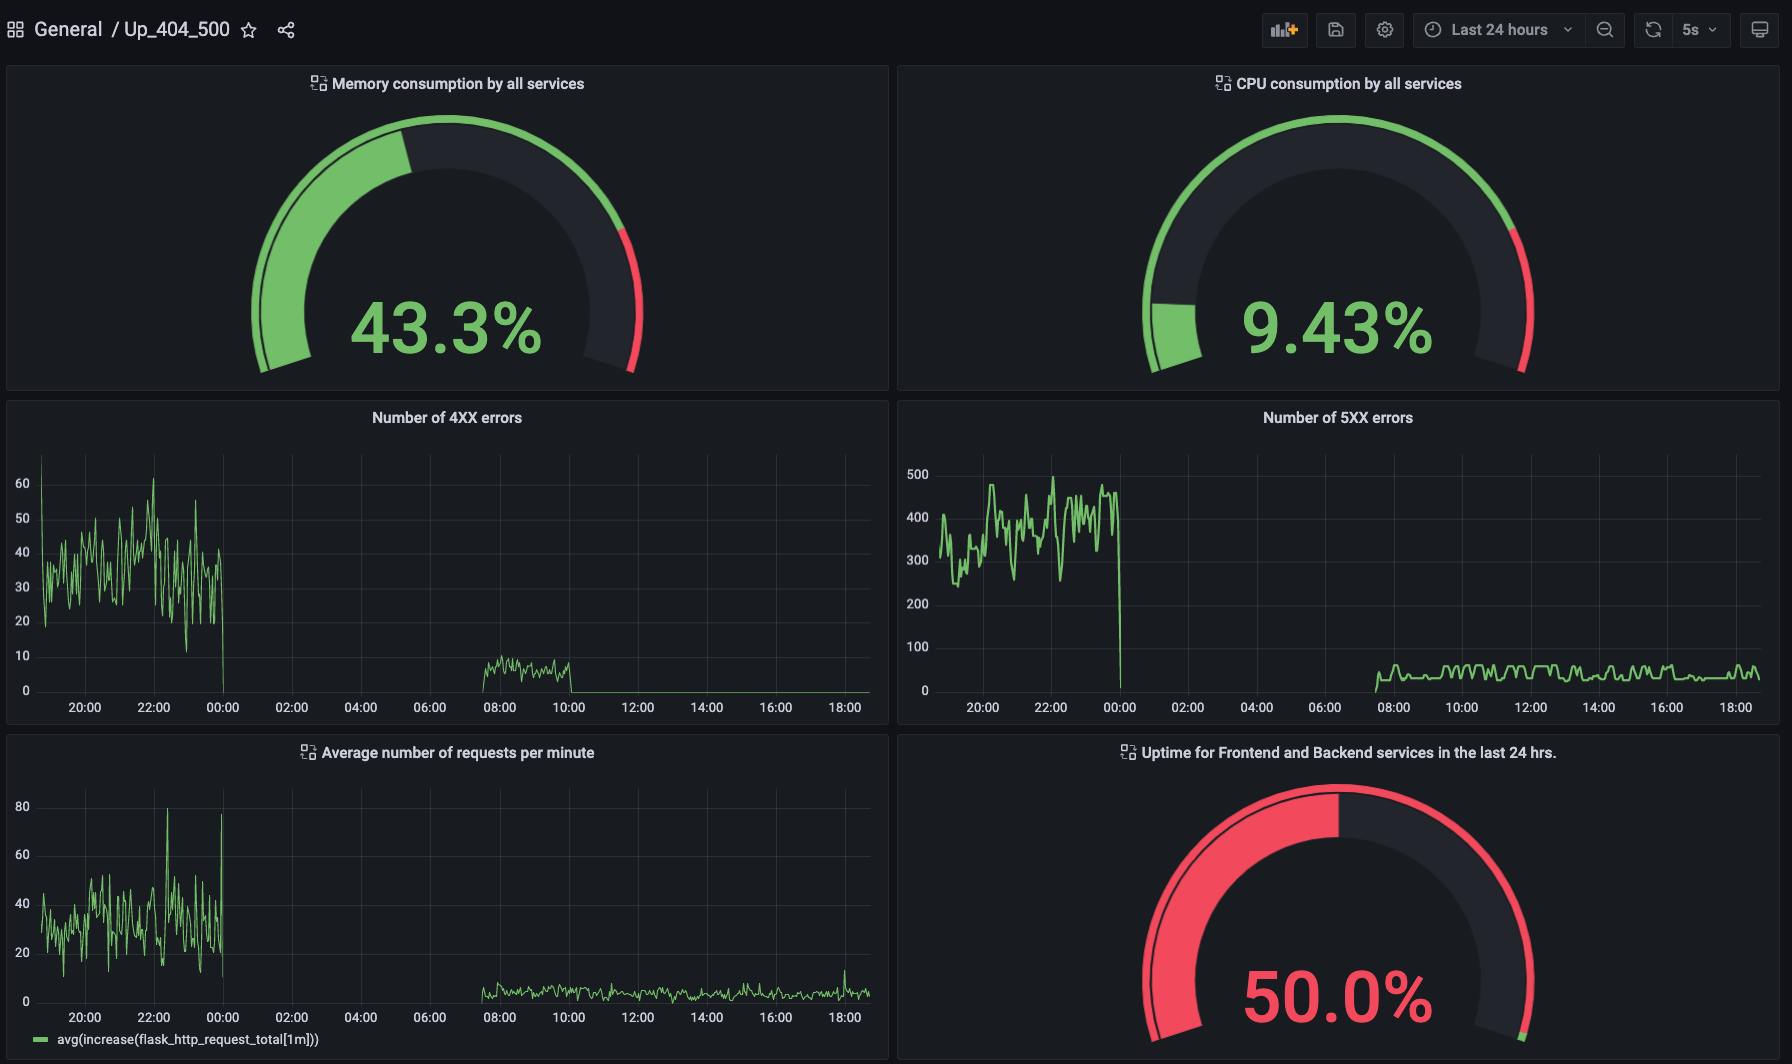
TODO: Create a dashboard to measure the uptime of the frontend and backend services We will also want to measure to measure 40x and 50x errors. Create a dashboard that show these values over a 24 hour period and take a screenshot.
I have included in the dashboard 6 KPIs:
- CPU and memory consumption (for saturation)
- Percentage uptime in the last 24 hours (for uptime)
- 4XX and 5XX errors as a function of time (for errors)
- Average number of requests per min (for traffic)
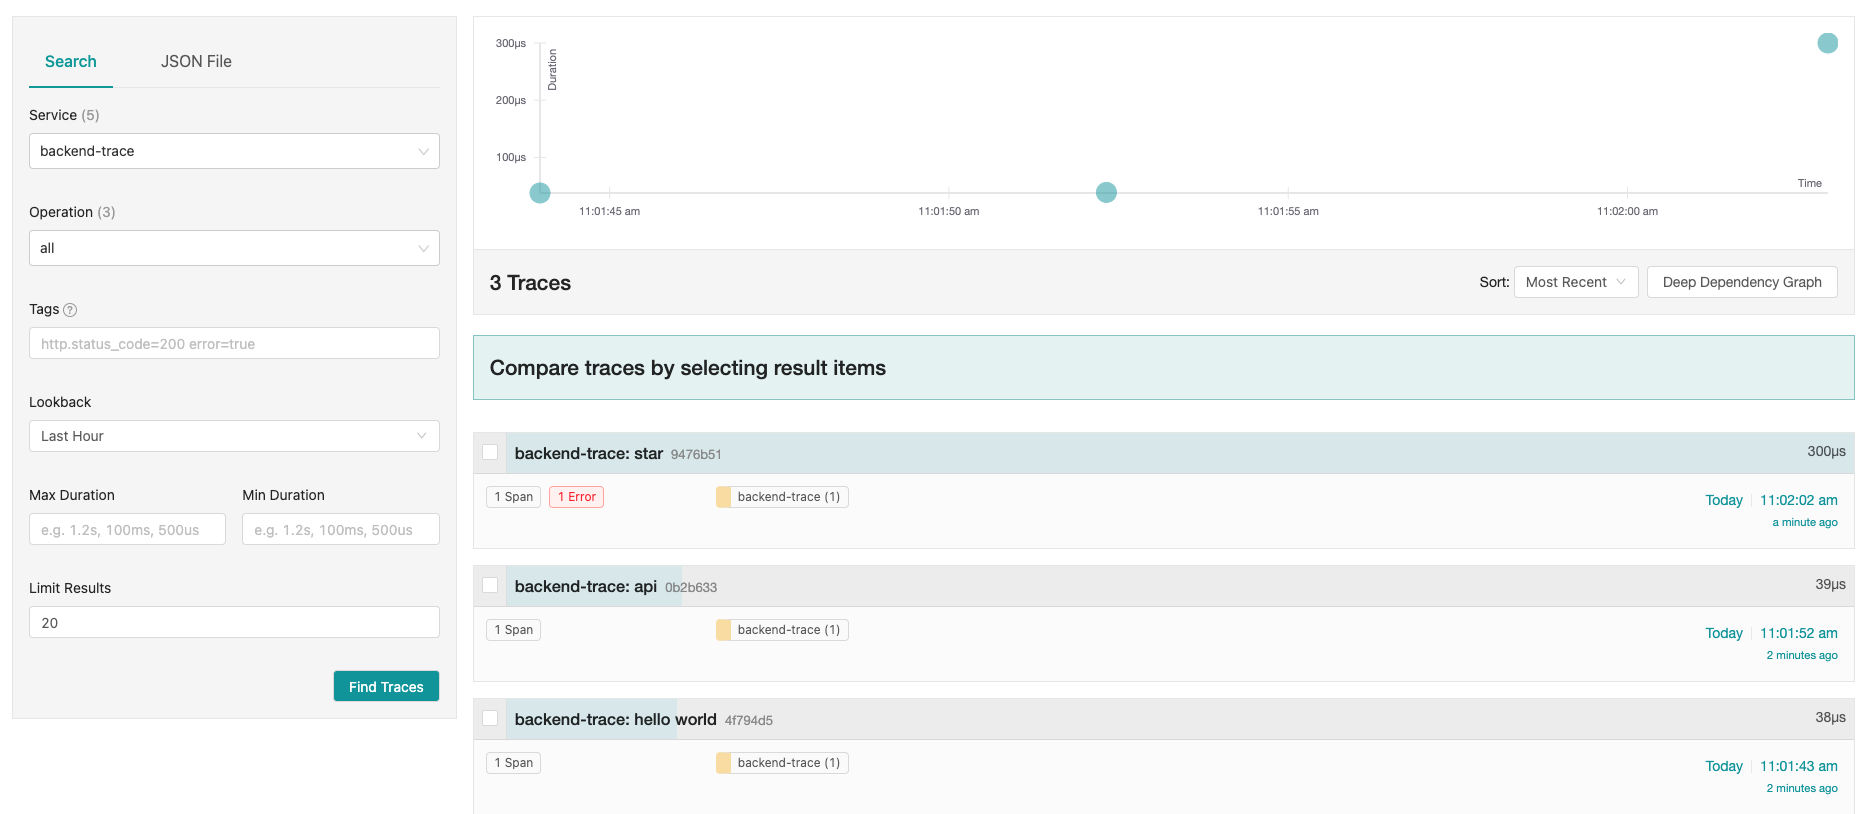
TODO: We will create a Jaeger span to measure the processes on the backend. Once you fill in the span, provide a screenshot of it here.
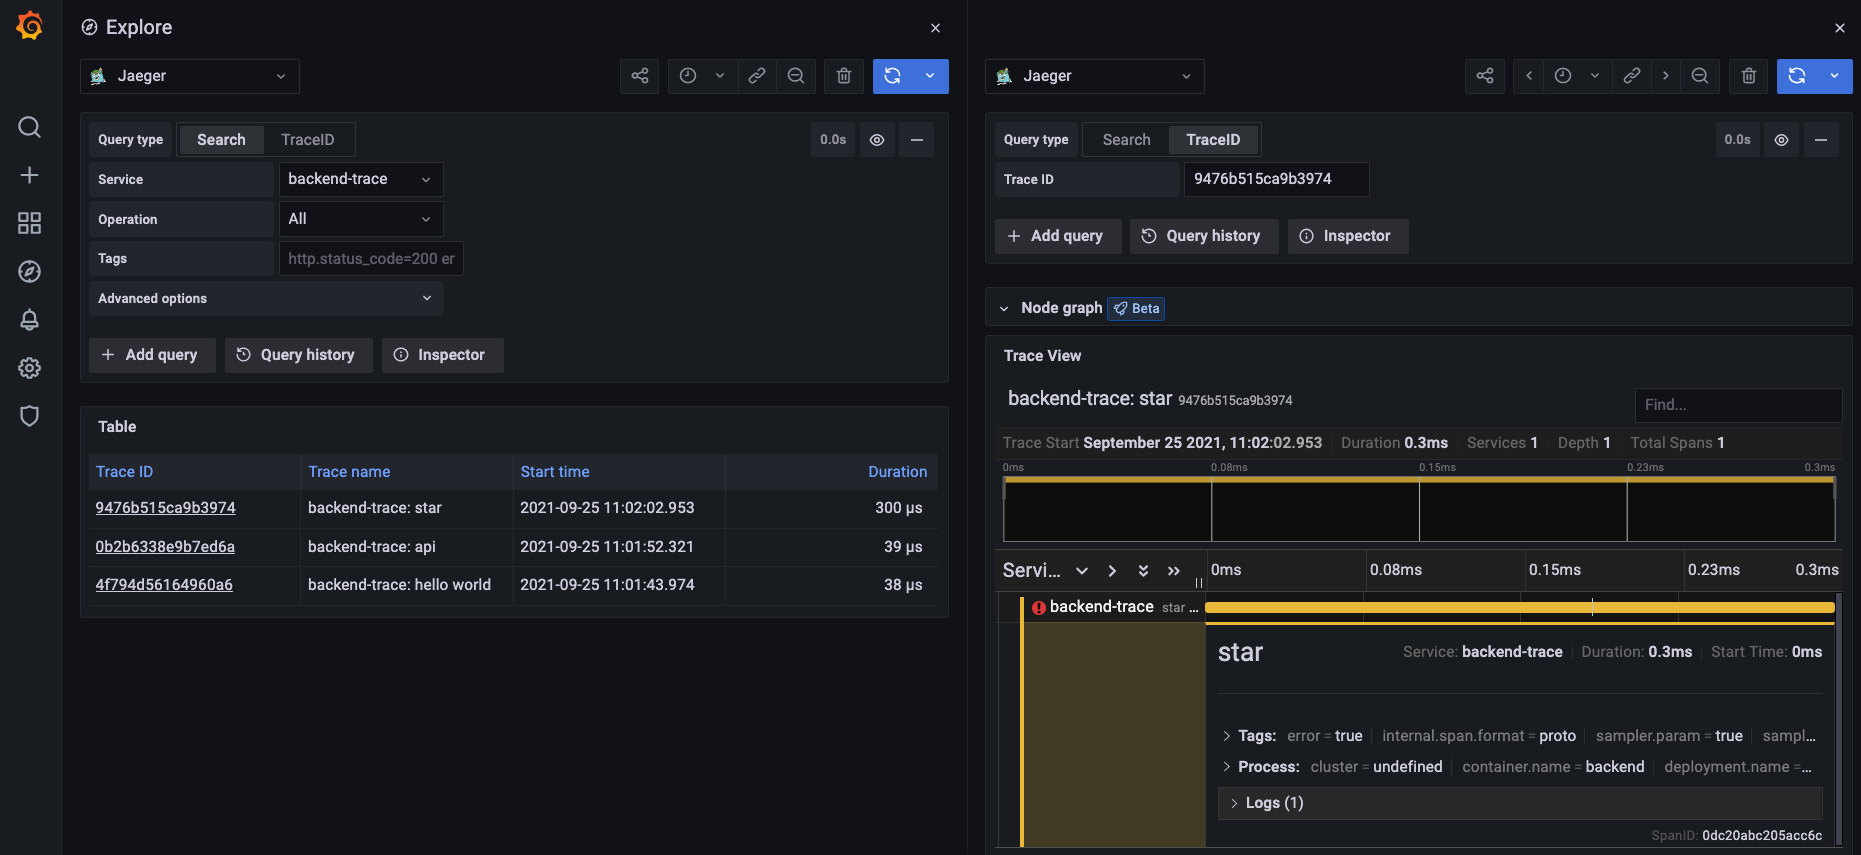
TODO: Now that the trace is running, let's add the metric to our current Grafana dashboard. Once this is completed, provide a screenshot of it here.
TODO: Using the template below, write a trouble ticket for the developers, to explain the errors that you are seeing (400, 500, latency) and to let them know the file that is causing the issue.
TROUBLE TICKET
Name: Backend service is showing 500 errors for the star endpoint
Date: Sept 27, 2021
Subject: MongoDB issues in Backend service
Affected Area: The /star endpoint in Backend service
Severity: critical
Description: The MongoDB has not been set up correctly for the /star endpoint in Backend service. We need to develop and test the deployment manifest.
TODO: We want to create an SLO guaranteeing that our application has a 99.95% uptime per month. Name three SLIs that you would use to measure the success of this SLO.
To demonstrate the success of achieving the SLO for 99.95% application uptime per month, I would measure 3 of the "Four Golden Signals", namely:
- Percentage of CPU and memory consumption in the last 1 month (for saturation).
- Percentage of Infrastructure uptime in the last 1 month (for error).
- Percentage of request response time less than 250 milliseconds (for latency).
- The average number of requests per minute in the last 24 hours (for traffic).
TODO: Now that we have our SLIs and SLOs, create KPIs to accurately measure these metrics. We will make a dashboard for this, but first write them down here.
For demonstration purposes, I would collect KPIs for a 24 hours period.
- CPU consumption should be less than 80%.
- Memory consumption should be less than 80%.
- Percentage of infrastructure uptime should be higher than 99.99%.
- Uptime for containers running Frontend and Backend services should show no interruptions.
- Percentage of request response time less than 250 milliseconds should be higher than 99.99%.
- 90 percentile of successful requests should take less than 100 ms to complete.
- There should not be any 500 errors in the last 24 hours.
- Average number of requests per minute should be less than 100.
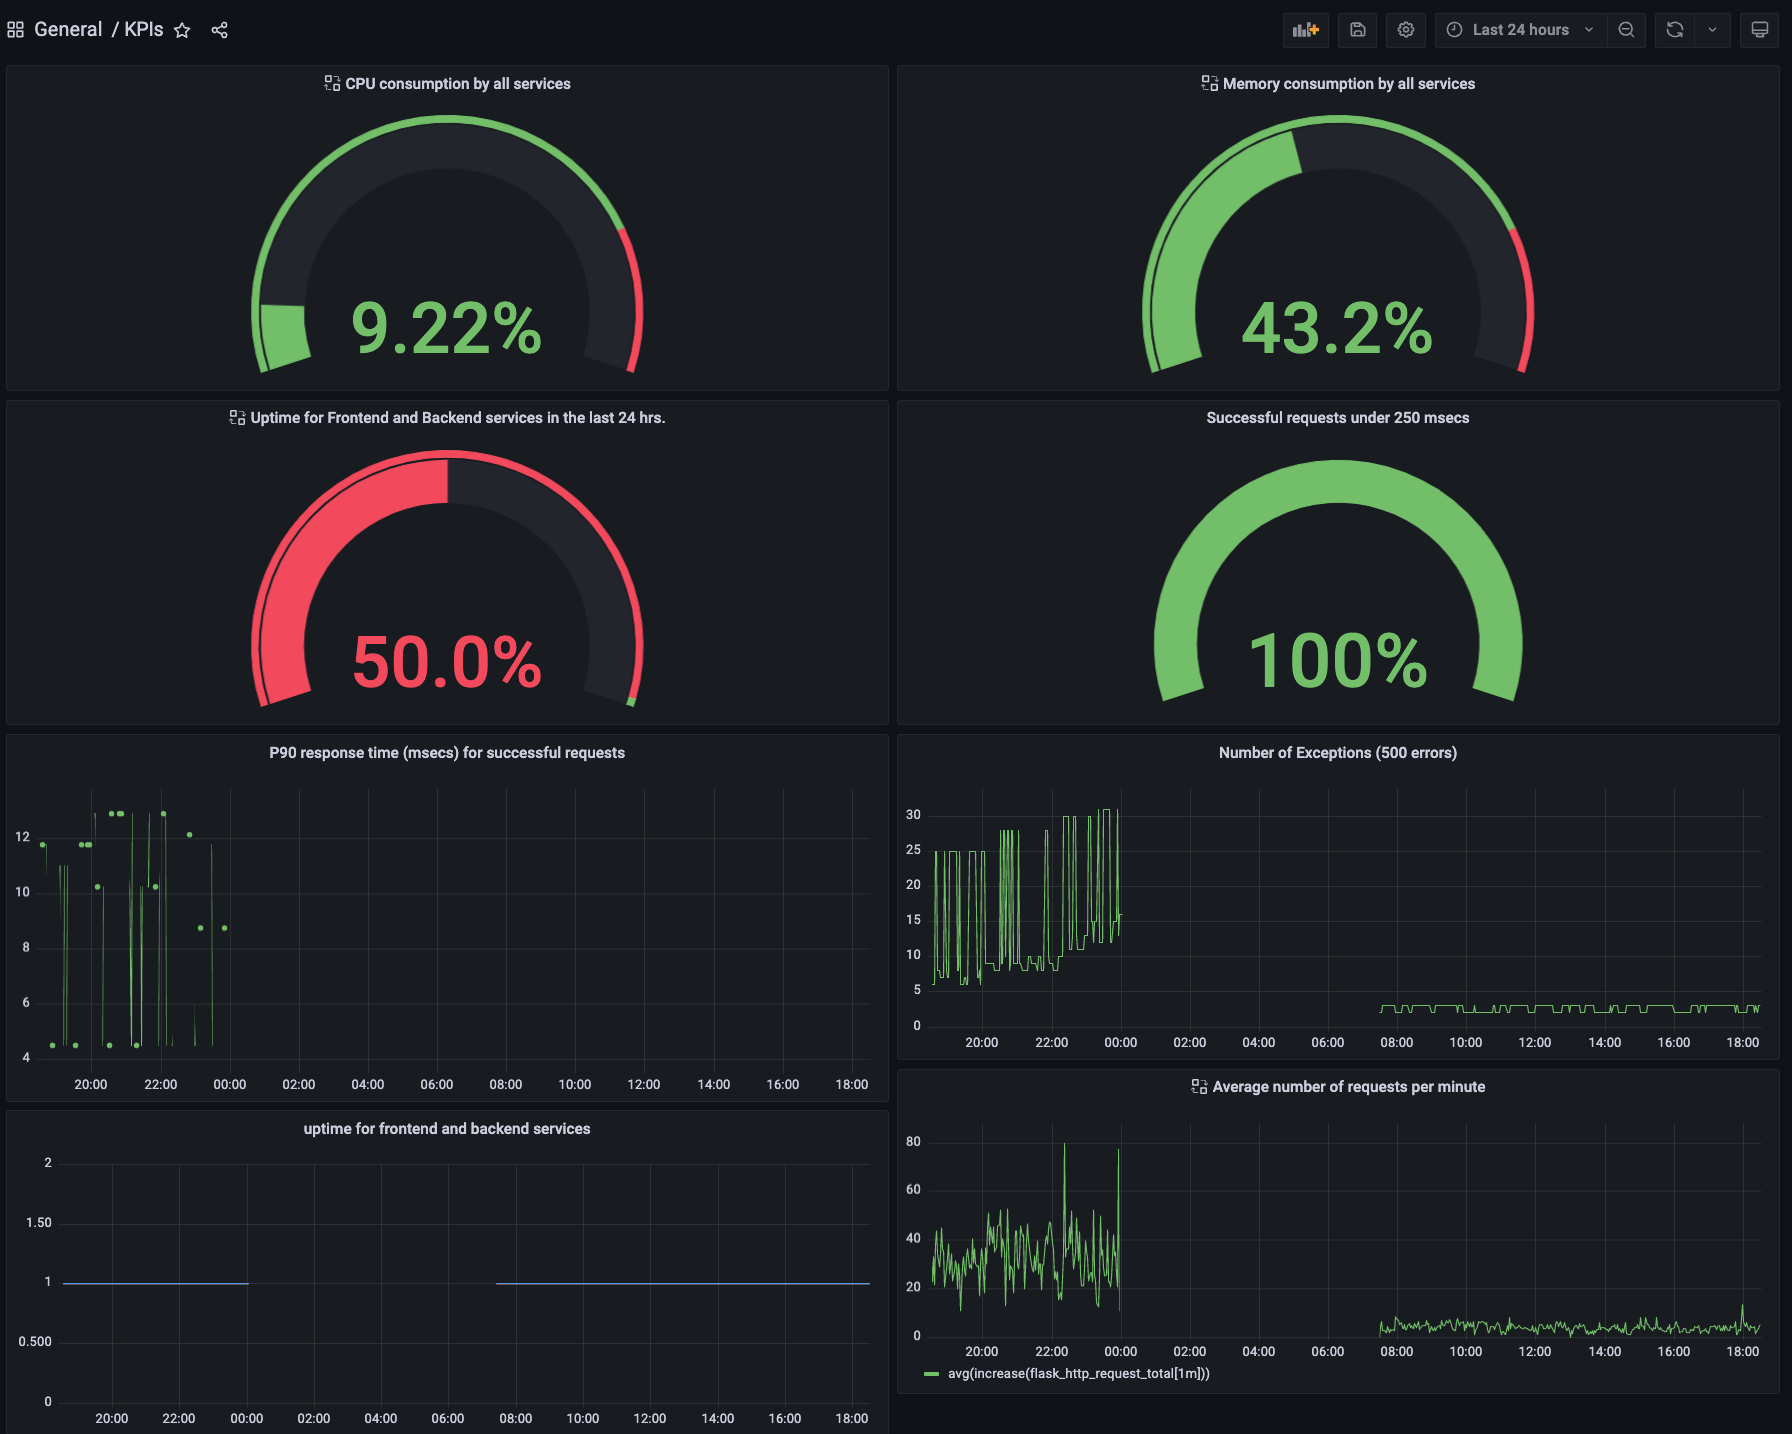
TODO: Create a Dashboard containing graphs that capture all the metrics of your KPIs and adequately representing your SLIs and SLOs. Include a screenshot of the dashboard here, and write a text description of what graphs are represented in the dashboard.
"CPU consumption by all services" measures the average CPU usage at 30 sec internals.
"Memory consumption by all services" measures the instantaneous memory consumption as a percentage of the system memory (8GB in this case).
"Uptime for frontend and backend services" measures the up or down state of the Frontend and Backend services in the last 24 hours.
"Successful requests under 250 mess" measures the percentage of requests with a 200 status code that received a response in less than or equal to 250 msecs.
"P90 response time (msecs) for successful requests" measures the 90 percentile of response times for Frontend and Backend API requests as a function of time in the last 24 hours.
"Number of Exceptions (500 errors)" measures the number of 500 errors as a function of time in the last 24 hours.
"Uptime for frontend and backend services" show the up and down states of these services.
"Average number frequents per minute" measures average the number of requests over 1 minutes intervals.
