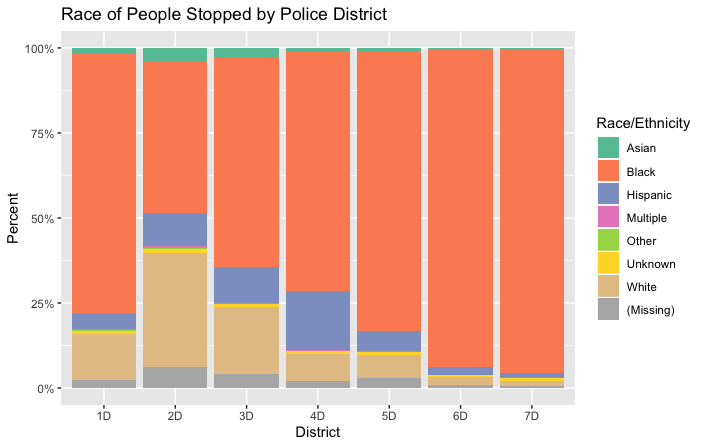
Data Source: MPD Stop Data, January 1-June 30, 2020
- 75% of the people stopped by MPD were Black.
- 87.1% of the youth stopped by MPD were Black.
- Black people who were stopped were more likely to have a non-ticket stop (48.2% non-ticket stop, 48.7% ticket only) - evidence of racial profiling? White and Asian people who were stopped were more likely to actually get a ticket (86% of Asian people stopped and 78% of white people stopped got tickets).
| Asian | Black | Hispanic | Multiple | Other | Unknown | White | |
|---|---|---|---|---|---|---|---|
| Harbor | 0.27 | 0.03 | 0.64 | 0.00 | 14.58 | 0.00 | 1.50 |
| Non-ticket Stop | 12.03 | 48.26 | 39.54 | 10.14 | 31.25 | 70.38 | 19.25 |
| Ticket and Non-ticket Stop | 1.07 | 3.00 | 1.93 | 1.45 | 0.00 | 2.78 | 0.95 |
| Ticket Only | 86.63 | 48.70 | 57.89 | 88.41 | 54.17 | 26.84 | 78.30 |
- Race demographics of stops vary significantly by police district.
- Person search or protective pat down 17% of Black people but 3.2% of white people
