Cable Modem Statistics Tool
- Introduction
- Requirements
- Supported devices
- Installation
- Usage
- Schedule
cmscraperexecution - Real case study (4G interference)
- How to contribute
- Final notes
cmstool can be used to generate SNR and Power statistics for cable modems by scraping this data from modem's Web UI interface. The statistics generated can help to identify a source of interference in one or multiple DOCSIS channels, that could lead to a degradation of the downstream signal.
The tool is composed by two main scripts:
-
cmsraper: command line tool used to scrape SNR and Power values from cable modem's Web UI interface and store them in a.csvfile. -
cmstats: command line tool used to parse.csvfile and generate statistics.
- Python 3.x
- Pip
- Docker (for cmstats)
For this beta version just only one:
- Technicolor DPC3848VE
cmscraper can be installed using pip:
pip install cmstool
cmstats can be executed using Docker. You can find the docker image in dockerhub
Just run the tool with --help argument to get a list of supported commands:
$ cmscraper_cli --help
usage: cmscraper_cli [-h] [-d DEVICE_NAME] [-i MODEM_IP_ADDRESS] [-o OUTPUT_PATH] [-t HTTP_TIMEOUT]

A Python tool that extracts statistics data from modem status web page.

optional arguments:
  -h, --help           show this help message and exit
  -d DEVICE_NAME       Device Name (Supported devices: technicolor-dpc384ve)
  -i MODEM_IP_ADDRESS  Modem IP Address (Default: 192.168.0.1)
  -o OUTPUT_PATH       Output path to store statistics
  -t HTTP_TIMEOUT      HTTP Client Timeout (Default: 10s)
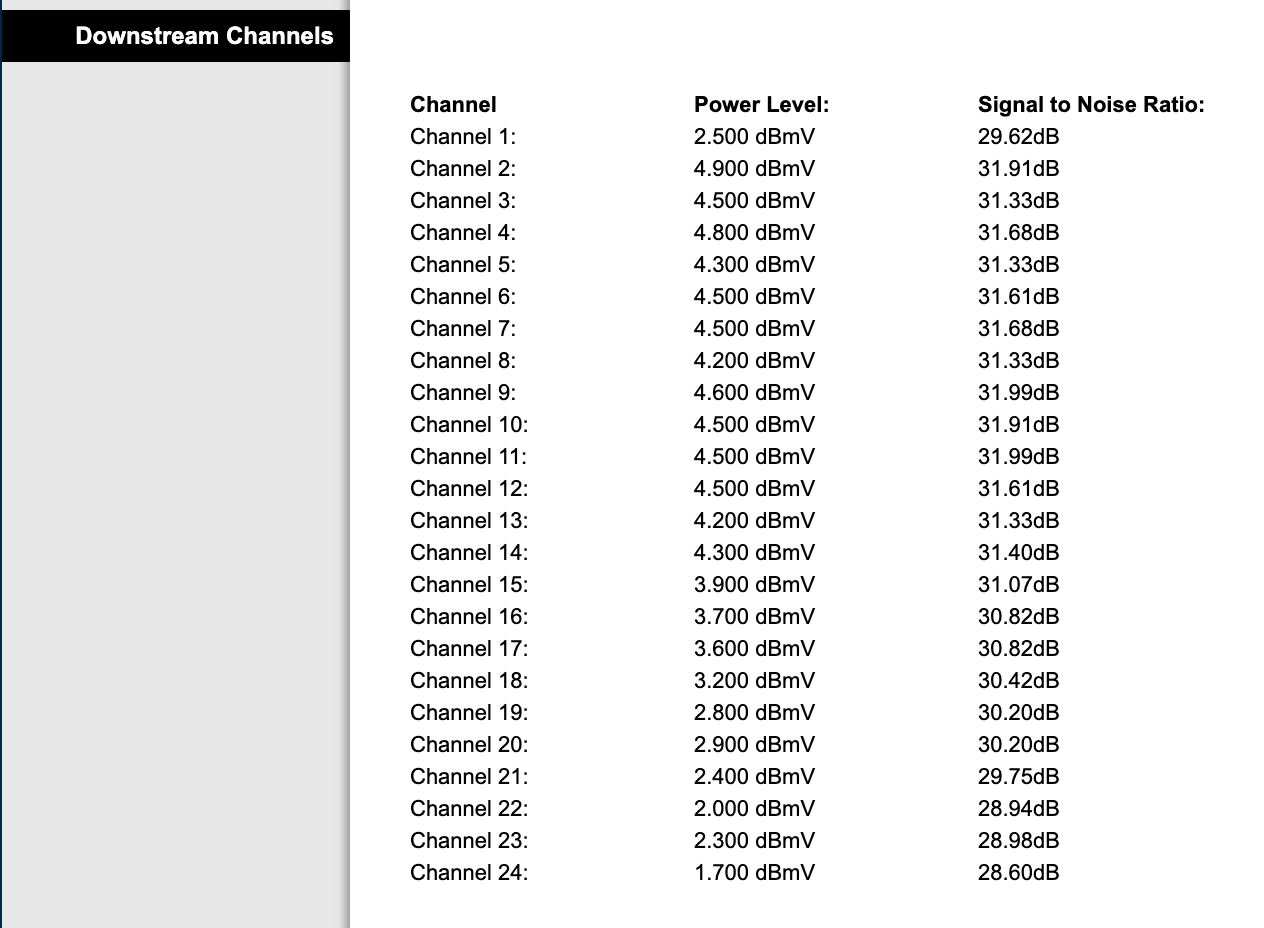
Now, supposing your modem's gateway is 192.168.0.1. If you go to the Web UI interface you might see something like this:
Try to scrape some data to ./stats folder:
$ cmscraper_cli -d technicolor-dpc384ve -o ./stats
Check ./stats directory, you should see a list of .csv files (one per channel):
$ ls stats/
0.csv  10.csv 12.csv 14.csv 16.csv 18.csv 2.csv  21.csv 23.csv 3.csv  5.csv  7.csv  9.csv
1.csv  11.csv 13.csv 15.csv 17.csv 19.csv 20.csv 22.csv 24.csv 4.csv  6.csv  8.csv
Have a look at one of those:
$ cat stats/14.csv
1606075264,3.4,37.63
1606076909,3.5,37.35
1606086304,5.0,37.35
1606086513,5.0,37.35
Each row contains the following columns: timestamp, power and snr
You should be ready to get some statistics using cmstats cli tool:
docker run -it --rm \
-p 8888:8888 \
-v ${PWD}/stats:/opt/cmstats/data  \
charlysan/cmstats \
--chr 0 24
The above will execute cmstats cli tool and map ./stats folder to /opt/cmstats/data on your container
(the default path containing your .csv files) and parse channel range through 0 to 24.
Note: channel 0 is the average value of the whole set of channels.
Expected results:
Ch 00: PWR avg: 03.82 dBmV / PWR std: 00.66 - SNR avg: 37.08 dB  / SNR std: 00.04
Ch 01: PWR avg: 02.67 dBmV / PWR std: 00.75 - SNR avg: 36.53 dB  / SNR std: 00.11
Ch 02: PWR avg: 04.97 dBmV / PWR std: 00.47 - SNR avg: 37.54 dB  / SNR std: 00.13
Ch 03: PWR avg: 04.60 dBmV / PWR std: 00.50 - SNR avg: 37.44 dB  / SNR std: 00.13
Ch 04: PWR avg: 04.87 dBmV / PWR std: 00.47 - SNR avg: 37.44 dB  / SNR std: 00.13
Ch 05: PWR avg: 04.37 dBmV / PWR std: 00.47 - SNR avg: 37.44 dB  / SNR std: 00.13
Ch 06: PWR avg: 04.50 dBmV / PWR std: 00.50 - SNR avg: 37.54 dB  / SNR std: 00.13
Ch 07: PWR avg: 04.43 dBmV / PWR std: 00.52 - SNR avg: 37.44 dB  / SNR std: 00.13
Ch 08: PWR avg: 04.07 dBmV / PWR std: 00.47 - SNR avg: 36.95 dB  / SNR std: 00.48
Ch 09: PWR avg: 04.43 dBmV / PWR std: 00.52 - SNR avg: 37.54 dB  / SNR std: 00.13
Ch 10: PWR avg: 04.63 dBmV / PWR std: 00.66 - SNR avg: 37.44 dB  / SNR std: 00.13
Ch 11: PWR avg: 04.63 dBmV / PWR std: 00.66 - SNR avg: 37.54 dB  / SNR std: 00.13
Ch 12: PWR avg: 04.63 dBmV / PWR std: 00.73 - SNR avg: 37.44 dB  / SNR std: 00.13
Ch 13: PWR avg: 04.40 dBmV / PWR std: 00.71 - SNR avg: 37.54 dB  / SNR std: 00.13
Ch 14: PWR avg: 04.50 dBmV / PWR std: 00.71 - SNR avg: 37.35 dB  / SNR std: 00.00
Ch 15: PWR avg: 04.07 dBmV / PWR std: 00.75 - SNR avg: 37.35 dB  / SNR std: 00.00
Ch 16: PWR avg: 03.83 dBmV / PWR std: 00.73 - SNR avg: 36.93 dB  / SNR std: 00.31
Ch 17: PWR avg: 03.77 dBmV / PWR std: 00.75 - SNR avg: 36.86 dB  / SNR std: 00.35
Ch 18: PWR avg: 03.30 dBmV / PWR std: 00.78 - SNR avg: 36.61 dB  / SNR std: 00.00
Ch 19: PWR avg: 02.97 dBmV / PWR std: 00.75 - SNR avg: 36.46 dB  / SNR std: 00.11
Ch 20: PWR avg: 03.03 dBmV / PWR std: 00.80 - SNR avg: 36.46 dB  / SNR std: 00.11
Ch 21: PWR avg: 02.53 dBmV / PWR std: 00.80 - SNR avg: 36.46 dB  / SNR std: 00.11
Ch 22: PWR avg: 02.13 dBmV / PWR std: 00.80 - SNR avg: 36.61 dB  / SNR std: 00.00
Ch 23: PWR avg: 02.43 dBmV / PWR std: 00.80 - SNR avg: 36.53 dB  / SNR std: 00.11
Ch 24: PWR avg: 01.90 dBmV / PWR std: 00.85 - SNR avg: 36.46 dB  / SNR std: 00.11

Serving to http://0.0.0.0:8888/    [Ctrl-C to exit]
172.17.0.1 - - [07/Dec/2020 03:23:43] "GET / HTTP/1.1" 200 -
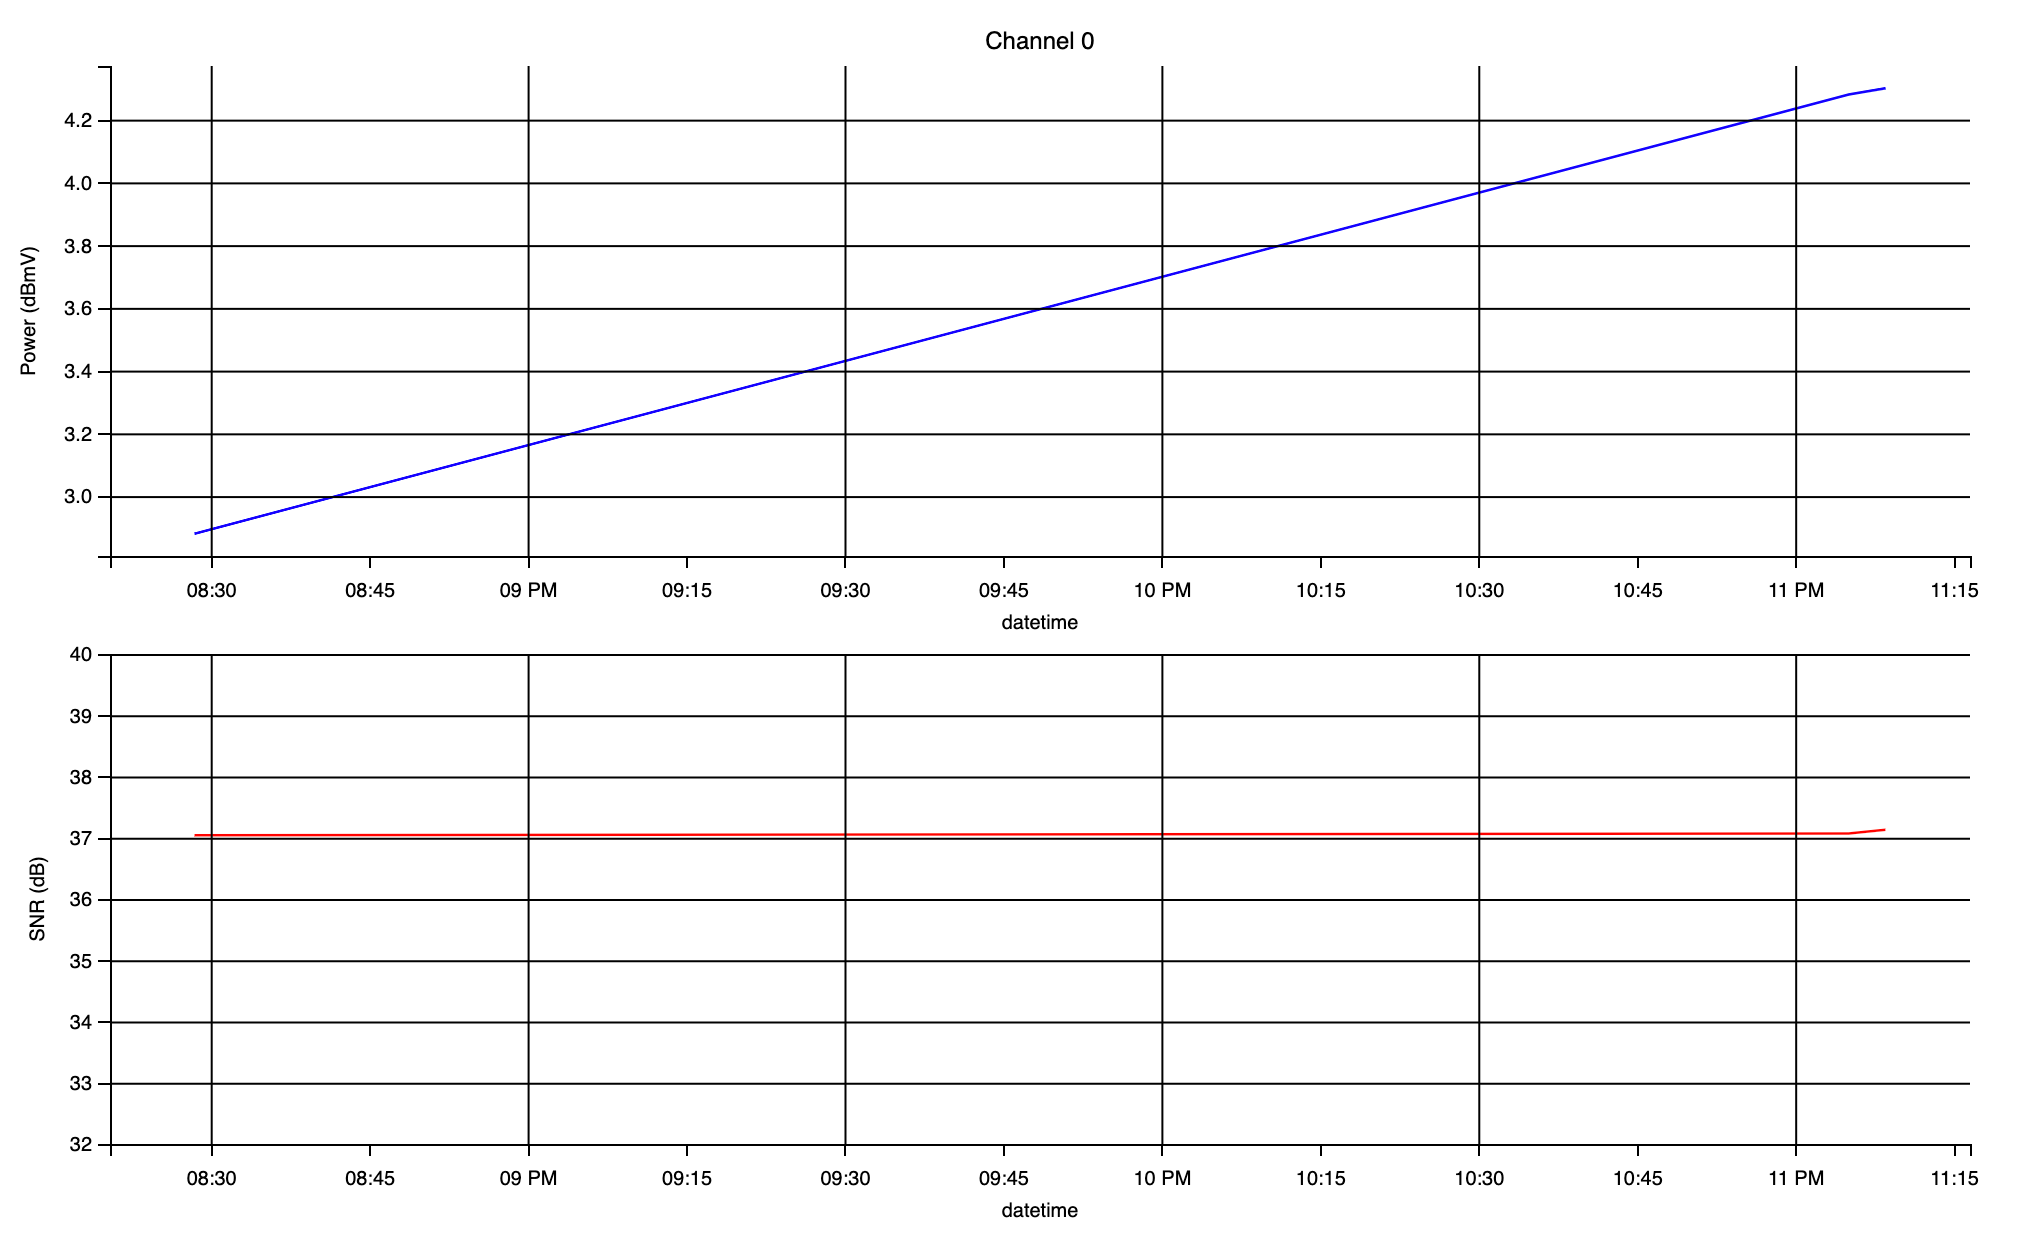
From the above listing you could already arrive to a conclusion just by looking at the average (SNR avg) and standard deviation (SNR std) values, but if you want to see how the SNR varies over time you can open http://0.0.0.0:8888 in your browser and you should see something like this:
Acceptable SNR Levels should be around 30-35 or greater depending on the modulation type. However the above example would be useless
as you only have 4 samples. To get a more significant result you need to take several samples in a long period of time, and to do that
you will need to schedule the execution of cmscraper_cli.
To get meaningful statistics results you need to gather several SNR samples in a long period of time (e.g. 8 hs.). To accomplish that
you could schedule a cron job using crontab, and execute cmscraper_cli every
5 minutes:
*/5 * * * * /usr/local/bin/cmscraper_cli -d technicolor-dpc384ve -o /home/pi/stats
Note: always use full path when calling cmscraper_cli (which cmscraper_cli) and when specifying output folder.
For convenience I used a raspberry pi connected to the gateway, installed cmscraper_cli there and scheduled the cronjob as listed above.
Then you could copy the .csv files to your computer using scp:
scp pi@192.168.0.34:/home/pi/stats/\*\.csv ./
Where 192.168.0.34 is my rpi ip address.
After that you should be able to parse your data using cmstats:
docker run -it --rm \
-p 8888:8888 \
-v ${PWD}:/opt/cmstats/data \
charlysan/cmstats \
--chr 0 24
Please refer to wiki DOCSIS cable modem and 4G interference document
The scraper tool could easily support many other devices. If you want to support a different device just create a Pull Request,
extend Scraper class, update cmscraper_cli and add your files under devices folder.
Don't forget to add a Unit Test like the included one
This is a beta version, so some bugs are expected. Error handling needs to be improved.


