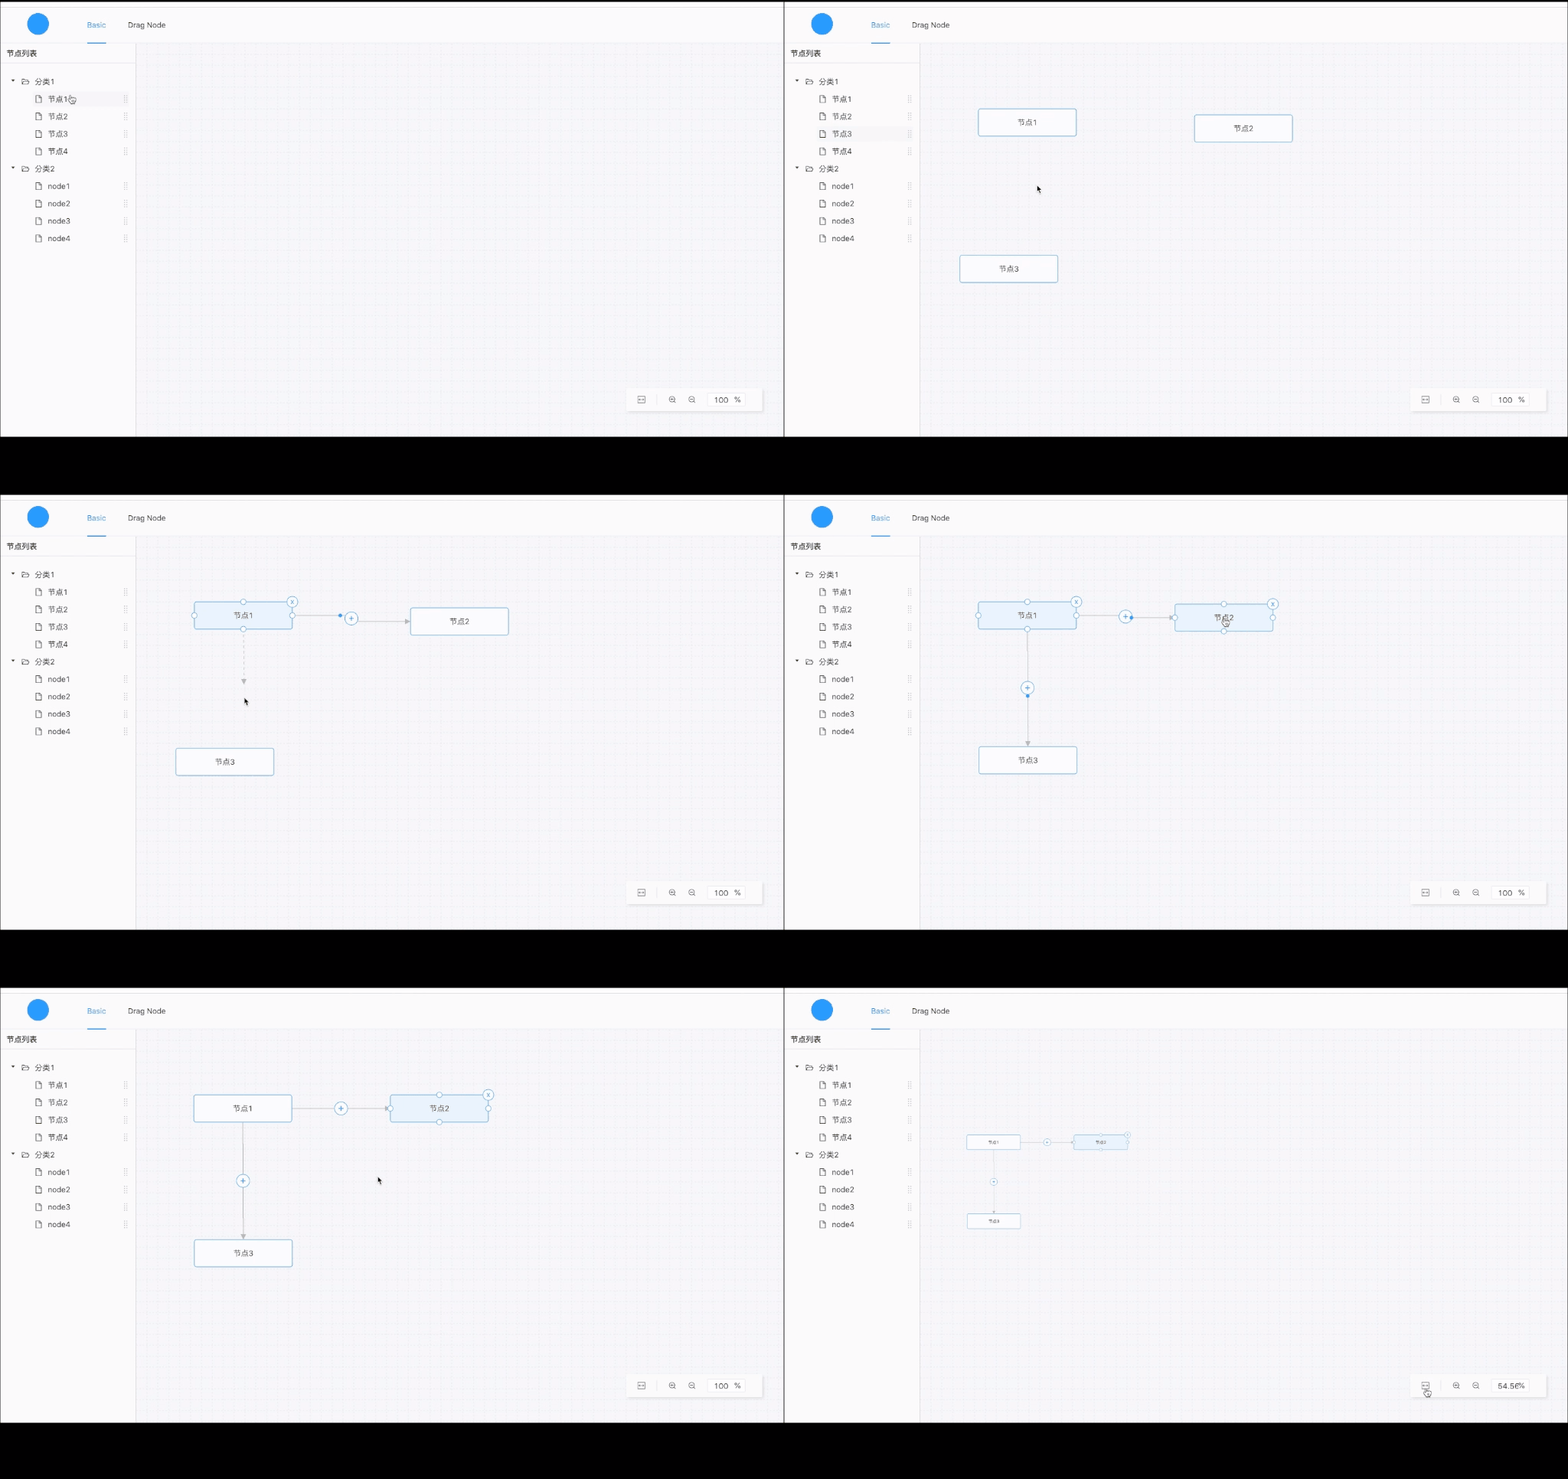
react data flow是基于d3、svg、canvas实现数据流程图的react库,能传入节点值,绘制节点,可通过节点拖拽生成边,支持节点的拖拽,删除,能支持节点的键盘事件,如向上、向下、向左、向右移动,delete键删除节点及相关联的边。
支持react hooks的方式,绑定useDFSelector方法,将dfInstance的实例以属性的方式传入React Data Flow,便可通过实例化dfInstance暴露出的方法,实现获取当前图上的节点、边、偏移量的数据,也可通过dfInstance.submit()方法,触发onFinish事件,返回图上数据。
npm install rdf-renderer
或
yarn add rdf-renderer
import React from 'react';

import ReactDataFlow, { Backgrounds, Controls, useDFSelector } from '@/index';

const width = document.body.clientWidth;
const height = 600;
const nodes = [
  {
    id: 'id_001',
    title: 'test',
    position: { x: 185, y: 231 },
  },
  {
    id: 'id_002',
    title: 'test1',
    position: { x: 500, y: 231 },
  },
  {
    id: 'id_003',
    title: 'test1',
    position: { x: 185, y: 492 },
  },
];

const edges = [
  {
    endDirection: 'top',
    endPosition: { x: 185, y: 492 },
    id: 'id_001-id_003',
    sourceId: 'id_001',
    startDirection: 'bottom',
    startPosition: { x: 185, y: 231 },
    targetId: 'id_003',
    text: 10,
  },
  {
    endDirection: 'left',
    endPosition: { x: 498, y: 231 },
    id: 'id_001-id_002',
    sourceId: 'id_001',
    startDirection: 'right',
    startPosition: { x: 185, y: 231 },
    targetId: 'id_002',
  },
];

// 背景参数
/*const gridConfig = {
  strokeColor: '#ccc', // 边的颜色
  strokeWidth: 1, // 边的宽度
  isLineDash: false, // 是否虚线显示
};*/

const Demo = () => {
  const [dfInstance] = useDFSelector();

  return (
    <div
      style={{
        width,
        height,
        border: '1px solid #ccc',
      }}>
      <button onClick={() => console.log(dfInstance?.getDfValues())}>获取当前值</button>
      <button onClick={() => dfInstance?.setEdgeValues({ edgeId: 'id_001-id_002', text: 99 })}>
        设置边的值
      </button>
      <button onClick={() => dfInstance?.submit()}>提交</button>
      <ReactDataFlow
        flow={dfInstance}
        nodes={nodes}
        edges={edges}
        isShowCircle={true}
        onCircleCallback={(data) => console.log(data)}
        onFinish={(data: any) => console.log(data)}>
        <Backgrounds />
        <Controls />
      </ReactDataFlow>
    </div>
  );
};

export default Demo;| 名称 | 描述 | 类型 | 默认值 | 版本 |
|---|---|---|---|---|
| nodes | 节点信息(必填) | Array | [] | 1.0.7 |
| edges | 边的信息(可选) | Array | [] | 1.0.7 |
| flow | 传入rdf的实例,用于控制图上信息的设置和获取(可选) | any | - | 1.0.7 |
| isShowCircle | 是否显示线上的圆(可选) | boolean | false | 1.0.7 |
| isCircleMove | 选中节点时,起点到终点小球运动(可选) | boolean | false | 1.0.7 |
| onCircleCallback | 线上圆的回调(可选) | (edge) => void | - | 1.0.7 |
| onFinish | 完成后的回调,需要通过实例化,调用submit方法触发(可选) | (data) => void | - | 1.0.7 |
- id: string(必填);
- position: { x: number, y: number }(必填);
- title: string(必填);
- 其他(待扩展);
- id: string(必填);
- startPosition: { x: number, y: number }(开始节点坐标)(必填)
- endPosition: { x: number, y: number }(结束节点坐标)(必填)
- sourceId: string(开始节点id)(必填)
- targetId: string(结束节点id)(必填)
- startDirection: string(开始节点方向:top、bottom、left、right)(必填)
- endDirection: string(开始节点方向:top、bottom、left、right)(必填)
- text: string(线上文本)
- 其他(待扩展)
边可以不用传,React Data Flow会帮助生成,数据的交互内部即可实现,能通过onFinish或dfInstance.getDfValues()返回数据。
| 名称 | 描述 | 类型 | 默认值 | 版本 |
|---|---|---|---|---|
| getDfValues | 获取节点和边的信息 | () => DataFlowTypes | {} | 1.0.7 |
| setEdgeValues | 设置边上圆上的回显值 | (data: {edgeId: string, text: 99 }) => void | {} | 1.0.7 |
| submit | 提交信息,触发onFinish事件,返回数据 | () => void | [] | 1.0.7 |
引入方式
import {Backgrounds} from 'rdf-renderer';

const gridConfig = {
  strokeColor: '#ccc', // 边的颜色
  strokeWidth: 1, // 边的宽度
  isLineDash: false, // 是否虚线显示
};

<ReactDataFlow flow={dfInstance} nodes={nodes} onFinish={onFinish}>
  <Backgrounds gridConfig={gridConfig} style={{ background: '#fff' }} />
</ReactDataFlow>| 名称 | 描述 | 类型 | 默认值 | 版本 |
|---|---|---|---|---|
| gridConfig | 背景参数配置(可选) | object | {} | 1.0.7 |
| gridConfig.strokeColor | 背景线条颜色 | string | '#E2E2F0' | 1.0.7 |
| gridConfig.strokeWidth | 背景线条宽度 | number | 1 | 1.0.7 |
| gridConfig.distance | 背景线条间距 | number | 20 | 1.0.7 |
| gridConfig.isLineDash | 是否虚线显示 | boolean | true | 1.0.7 |
| gridConfig.lineDash | 虚线的间距 | Array<[number, number]> | [3, 3] | 1.0.7 |
| style | 支持原生标签的style样式 | - | - | 1.0.7 |
引入方式
import {Controls} from 'rdf-renderer';

// ...

<ReactDataFlow flow={dfInstance} nodes={nodes} onFinish={onFinish}>
  <Controls />
</ReactDataFlow>
控件目前是写死的,后期会根据选项是否支持特定功能。
当前版本是根据公司需求完成符合指定需求的产品,后期会慢慢扩展,若有要求提issues。
