MetaComp
Metagenome comparison heatmap.


0.0 Installation from latest sources
install.packages("devtools")
library(devtools)
install_github('seninp-bioinfo/MetaComp')
to use the library, simply load it into R environment:
library(MetaComp)
1.0 Reading a single GOTTCHA assignment file
the_gottcha_assignment <- load_gottcha_assignments(data_file)
1.1 Reading multiple GOTTCHA assignment files
The package function load_gottcha_assignments can be used to read GOTTCHA assignments from multiple filesystem locations when configured by a single tab-delimeted two columns file -- first column for the project id, second column for the assignment file:
the_assignments_list <- load_gottcha_assignments(config_file)
2.0 Merging multiple GOTTCA assignments into a single table
The merge_gottcha_assignments function is capable to merge a named list of GOTTCHA assignments into a single table using LEVEL and TAXA columns as ids.
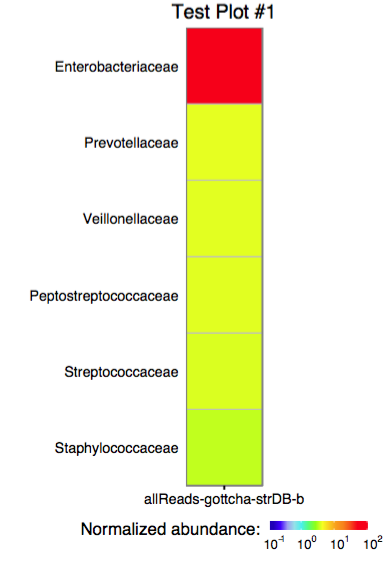
3.0 Plotting a single assignment as a heatmap
The function plot_gottcha_assignment accepts a single assignment table and outputs a ggplot object or produces a PDF plot using ggplot2's geom_tile.
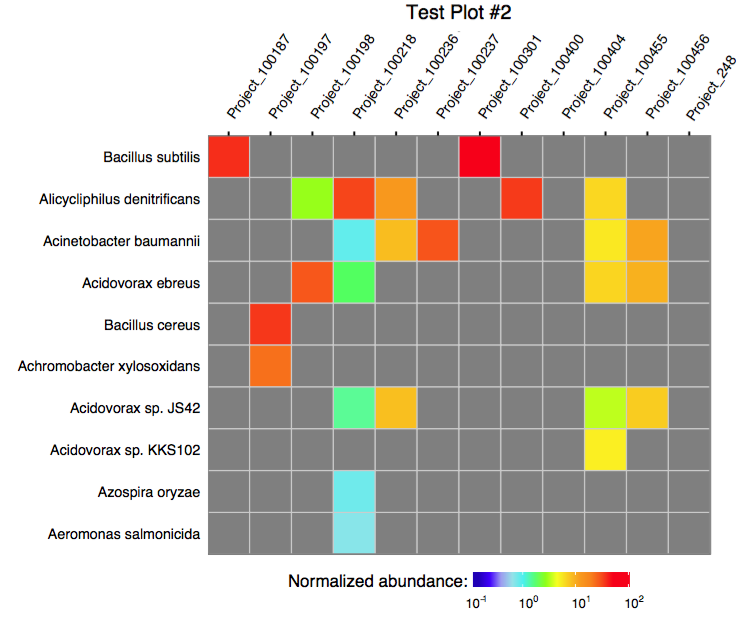
3.1 Plotting multiple assignments as a single heatmap
The function plot_gottcha_assignment accepts a single merged assignment table and outputs a ggplot object or produces a PDF plot using ggplot2's geom_tile.
4.0. Running merge in a batch mode
The following script can be used to run the merge procedure in a batch mode:
# load library
require(MetaComp)
#
# configure runtime
options(echo = TRUE)
args <- commandArgs(trailingOnly = TRUE)
#
# print provided args
print(paste("provided args: ", args))
#
# acquire values
srcFile <- args[1]
destFile <- args[2]
taxonomyLevelArg <- args[3]
plotTitleArg <- args[4]
plotFile <- args[5]
#
# read the data and produce the merged table
merged <- merge_gottcha_assignments(load_gottcha_assignments(srcFile))
#
# write the merge table as a TAB-delimeted file
write.table(merged, file = destFile, col.names = T, row.names = F, quote = T, sep = "\t")
#
# produce a PDF of the merged assignment
plot_merged_assignment(merged, taxonomyLevelArg, plotTitleArg, plotFile)
To execute the scrip, use Rscript as shown below:
$> Rscript merge_and_plot_gottcha_assignments.R assignments_table.txt merged_assignments.txt \
                                                                 family "Merge test plot" merge_test
this command line arguments are (some of these are clickable -- so you can see examples):
Rscript- a way to execute the R scriptmerge_and_plot_gottcha_assignments.R- the above script filenameassignments_table.txt- the tab delimeted table of assignments (two columns:project_idTABassignment_path)merged_assignments.txt- the tab-delimeted output file namefamily- a LEVEL at which the plot should be produced"Merge test plot"- the output plot's titlemerge_test- the output plot filename mask,".pdf"and".svg"files will be produced...