A Pilot Project for scoping an upcoming hackathon focused on metatranscriptomics including topics such as Read Counts, Novel Transcripts and Population Level Functions.
Authors:
Allissa Dillman
Defne Surujon
Shurjo Sen
HUMAnN2 (Franzosa et al., 2018):
http://huttenhower.sph.harvard.edu/humann2
- ID species
- map reads to pangenome of found species
- translated-search for unclassified genes
- gene family and pathway abundance (RPKM)
SAMSA2 (Westreich et al., 2018):
https://transcript.github.io/samsa2/
- matching pair-end reads, QC, remove ribosomal
- align and annotate
- subsystems/RefSeq analysis (DEseq2)
MetaTrans (Martinez et al., 2016):
http://www.metatrans.org/
- QC, remove ribosomal
- use rRNA for OTU analysis (QIIME)
- use non rRNA for mapping, functional assignment, differential expression (DEseq2)
SqueezeMeta (Tamames and Puente-Sanchez, 2019):
- Accommodates nanopore long reads
- Metagenomics and metatranscriptomics
- Co-assembly of multiple metagenomes simultaneously
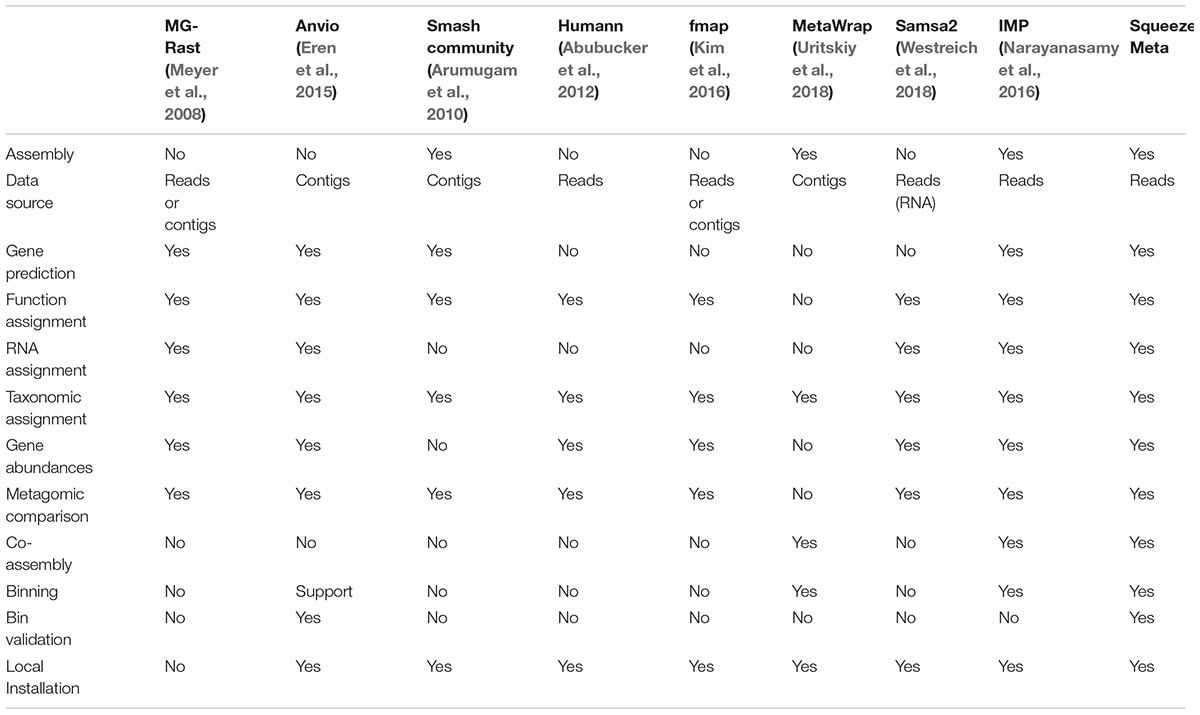
From SqueezeMeta paper: comparison of different tools:
1.) Looking for mismatch between DNA and RNA, as in low signal in DNA high in RNA and vice-versa. - This is the idea we explored in more detail
2.) Able to process short OR long read data - SqueezeMeta claims to do this
3.) If methylation data is available, match methylation data with transcription
4.) “Dark Matter” of metatranscriptomics data: how do we use seq’s that don’t align to any reference genome? How to get functional insight into unaligned reads - HUMANn2 addresses this
5.) Normalization of expression data based on taxon abundance
5.b) Take gene copy number into account (same gene may be duplicated in the same genome)
6.) Co-assembly of multiple metagenomes - SqueezeMeta addresses this
| Name | Type | Number of Samples | Publication | SRA Accession | Other Data Resource | Other associated Data |
|---|---|---|---|---|---|---|
| IBDBMDB | matched MGX and MTX | 735 | Lloyd-Price et al., 2019 | PRJNA398089 | https://ibdmdb.org/ | Metabolomics, host transcriptomics, 16S, viromics, proteomics, serology |
| Human Stool pilot | matched MGX and MTX | 8 | Franzosa et al., 2019 | PRJNA188481 | ||
| Activated sludge | matched MGX and MTX | 3 | Liu et al., 2019 | PRJNA406858 |
1. Identify persisters/dormant species in a community
Persisters are often defined as metabolically inactive bacteria, characterized by arrested growth, low ATP levels, and low mRNA expression. Bacteria can enter a persister state when exposed to supra-lethal concentrations of antibiotic, and can resume growth after the antibiotic is removed from the environment (Fisher et al., 2017). Thus, persistence is a form of transient antibiotic tolerance, and can cause treatment failure and relapse of infection in the clinic (even in the absence of antibiotic resistance). It is therefore crucial to be able to detect persisters in clinical samples. One possible method of detection of persisters is genome-wide absence of RNA transcripts, but a presence of genomic DNA. This can be accomplished by considering the mean or median RNA vs DNA abundances across all pathways of each individual species.


Mean RNA and DNA abundances for Eschericia coli (top) and Bacteroides vulgatus (bottom). Each point represents a patient sample. Most patients have lower (relative) amounts of RNA from B. vulgatus compared to DNA, and the converse is true for E. coli.
Jupyter notebook - generation of this figure
2. Which genes/pathways are differentially expressed depending on their genetic context?
Homologs of the same gene may be differentially expressed depending on which bacterial species they appear in, despite being in the same environment. This may result in an oversimplification/misinterpretation of metatranscriptomic data. For example, one gene/pathway may be found in high abundance in two very different samples, due to this gene being upregulated in response to different cues, in different organisms. These two cases of high transcript abundance are not biologically equivalent.
Can this be explained by methylation patterns? different regulatory elements in different organisms affecting homologs?
3. Which genes/pathways (across samples) vary a lot in their expression, but not in their DNA copy number?
Similar to how the same genome in a human can yield vastly different cell types, similar metagenomic compositions in microbial communities can have vastly different transcriptional/functional profiles (Franzosa et al., 2014). While for most genes/pathways there may be a strong correlation between RNA and DNA abundance, there are examples of pathways where DNA abundance does not vary much across samples, but RNA abundance does.


Arginine synthesis (top) and Fucose-rhamalose catabolism (bottom) pathways. Each point is a patient sample. For the arginine synthesis pathway, RNA and DNA abundance correlate well. However for the fucose-rhamalose catabolism pathway is an example of low variability in terms of DNA abundance, but high variability in RNA abundance.
Jupyter notebook - generation of this figure
4. Is the taxonomic profile we get from MetaTrans similar to one from metagenomic taxonomic profiles reported?
The MetaTrans paper shows some differences between 16S rRNA profiles and 16S rDNA profiles. They attribute this to 16S rDNA not being able to capture the "active" microbial community.
5. Try to classify clinical outcome (IBD/CD/UC vs healthy) based on metatranscriptomic profiles
Existing studies aim to classify healthy vs diseased patients based on NGS data (Bang et al., 2019; Pasolli et al., 2016). Early analysis of metatranscriptomic data has has identified differentially expressed pathways in periodontal disease when compared to healthy oral microbial communities (Jorth et al., 2014). Transcriptomic profiling data potentially has richer and more informative features than metagenomic or 16S data; since it provides information on which genes and pathways have higher transcript abundance and may contribute to a host phenotype. The IBDMDB dataset would be a good testing ground for training ML models, as it has metatranscriptomics data, and disease metadata.
As a pilot experiment, we trained 7 machine learning models (decision tree, logistic regression, SVM, Naive Bayes, K-nearest neighbor, random forest and multi-layer perceptron) using the pathway abundance data extracted from the metatranscriptomics data from the HMP2 cohort in IBDMDB. A majority voting consensus model was also generating using the outputs of the 7 individual trained models.

Confusion matrix of the consensus model for the training set(left) and test set (right). nonIBD: no Inflammatory Bowel Disease. UC: Ulcerative colitis. CD: Crohn's Disease.
Individual models and code here
6. Inferring metabolomic profiles from metatranscriptomic data (can we avoid doing LC-MS??)
The IBDMDB dataset is a comprehensive multi-omics dataset that includes metatranscriptomics and metabolomics data. Generating both metatranscriptomic and metabolomic data can be labor-intensive, time-consuming and expensive. Moreover, MS often cannot distinguish between highliy similar metabolites [REF], and transcriptomics would potentially provide more detailed information on which metabolic processes are active. Therefore, it would be advantageous to be able to infer the metabolomic profile of a sample in silico using metatranscriptomic data. Flux Balance Analysis (Feist et al., 2007; Orth et al., 2010) is a potential approach that can be applied.
Processed data was downloaded from the Inflammatory Bowel Disease Multi'omics Database (IBDMDB; PRJNA398089) at https://ibdmdb.org/ . Patient metadata, including inflammatory bowel disease information, was also obtained from the same source. Metagenomics and metatranscriptomics data were obtained as taxon and pathway abundance tables respectively. Comparison of metagenomic and metatranscriptomic abundances were done using custom code available in: https://github.com/NCBI-Hackathons/Metatranscriptomics_Pilot/blob/master/Pathways%20MGX%20vs%20MTX.ipynb
To see whether metatranscriptomic data is predictive of disease state of an individual, 7 machine learning classification models were trained and subsequently combined in a consensus model that classifies disease outcome. A random selection of a third of the individuals were placed in a test set to evaluate the performance of the consensus model and these individuals were not used in any training step. The input features consisted of the relative abundance of each metabolic pathway, which were normalized to have 0 mean and equal variance. The models trained include Decision Tree, K-Nearest Neighbor, Support Vector Machine, Logistic Regression, Random Forest, and Multi-Layered Perceptron. Each model was trained on the training data, using hyperparameter tuning with 5-Fold crossvalidation. The 7 models were then combined using a majority vote scheme into a consensus model. The performance of the consensus was evaluated on the training and previously unseen test datasets. All machine learning analysis was done using the python library scikit-learn. Code and hyperparameter grids can be found in: https://github.com/NCBI-Hackathons/Metatranscriptomics_Pilot/blob/master/jupyter/ML%20models%20for%20IBD%20disease%20classification.ipynb
- Feist AM, Henry CS, Reed JL, Krummenacker M, Joyce AR, Karp PD, et al. A genome-scale metabolic reconstruction for Escherichia coli K-12 MG1655 that accounts for 1260 ORFs and thermodynamic information. Mol Syst Biol [Internet]. 2007 Jun 26 [cited 2019 Aug 15];3. Available from: https://www.ncbi.nlm.nih.gov/pmc/articles/PMC1911197/
- Bang S, Yoo D, Kim S-J, Jhang S, Cho S, Kim H. Establishment and evaluation of prediction model for multiple disease classification based on gut microbial data. Sci Rep. 2019 Jul 15;9(1):1–9.
- Pasolli E, Truong DT, Malik F, Waldron L, Segata N. Machine Learning Meta-analysis of Large Metagenomic Datasets: Tools and Biological Insights. PLOS Computational Biology. 2016 Jul 11;12(7):e1004977.
- Liu Z, Klümper U, Liu Y, Yang Y, Wei Q, Lin J-G, et al. Metagenomic and metatranscriptomic analyses reveal activity and hosts of antibiotic resistance genes in activated sludge. Environment International. 2019 Aug 1;129:208–20.
- Martinez X, Pozuelo M, Pascal V, Campos D, Gut I, Gut M, et al. MetaTrans: an open-source pipeline for metatranscriptomics. Scientific Reports. 2016 May 23;6:26447.
- Jorth P, Turner KH, Gumus P, Nizam N, Buduneli N, Whiteley M. Metatranscriptomics of the Human Oral Microbiome during Health and Disease. mBio. 2014 May 1;5(2):e01012-14.
- Lloyd-Price J, Arze C, Ananthakrishnan AN, Schirmer M, Avila-Pacheco J, Poon TW, et al. Multi-omics of the gut microbial ecosystem in inflammatory bowel diseases. Nature. 2019 May;569(7758):655–62.
- Fisher RA, Gollan B, Helaine S. Persistent bacterial infections and persister cells. Nature Reviews Microbiology. 2017 Aug;15(8):453–64.
- Franzosa EA, Morgan XC, Segata N, Waldron L, Reyes J, Earl AM, et al. Relating the metatranscriptome and metagenome of the human gut. Proceedings of the National Academy of Sciences. 2014 Jun 3;111(22):E2329–38.
- Franzosa et al. - 2014 - Relating the metatranscriptome and metagenome of t.pdf [Internet]. [cited 2019 Aug 15]. Available from: https://www.pnas.org/content/pnas/111/22/E2329.full.pdf
- Westreich ST, Treiber ML, Mills DA, Korf I, Lemay DG. SAMSA2: a standalone metatranscriptome analysis pipeline. BMC Bioinformatics. 2018 May 21;19(1):175.
- Tamames J, Puente-Sánchez F. SqueezeMeta, A Highly Portable, Fully Automatic Metagenomic Analysis Pipeline. Front Microbiol [Internet]. 2019 [cited 2019 Aug 15];9. Available from: https://www.frontiersin.org/articles/10.3389/fmicb.2018.03349/full
- Orth JD, Thiele I, Palsson BØ. What is flux balance analysis? Nat Biotechnol. 2010 Mar;28(3):245–8.