Figure out how to get consistent delG predictions
sonyahanson opened this issue · 10 comments
I'm currently writing a interface that quick analyses, stores, and makes a figure of results for bayesian analysis, and noticed that for our the simple pymc model function, we aren't getting consistent results when rerunning the analysis:
from assaytools import pymcmodels
            pymc_model = pymcmodels.make_model(Pstated, dPstated, Lstated, dLstated,
               top_complex_fluorescence=reorder_protein,
               top_ligand_fluorescence=reorder_buffer,
               use_primary_inner_filter_correction=True,
               use_secondary_inner_filter_correction=True,
               assay_volume=assay_volume, DG_prior='uniform')
I mentioned these inconsistencies in my last labmeeting, and this is a big reason why I've started working on #56, but just thought I'd post it here as well, since it's coming up again.
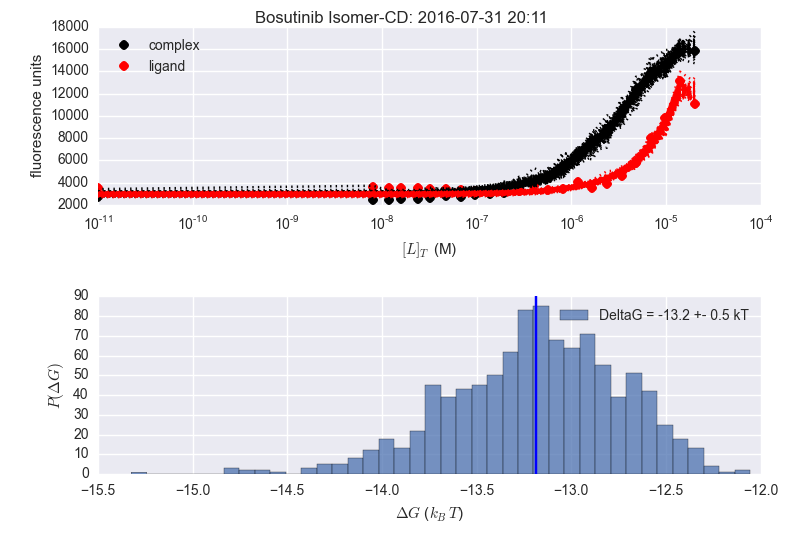
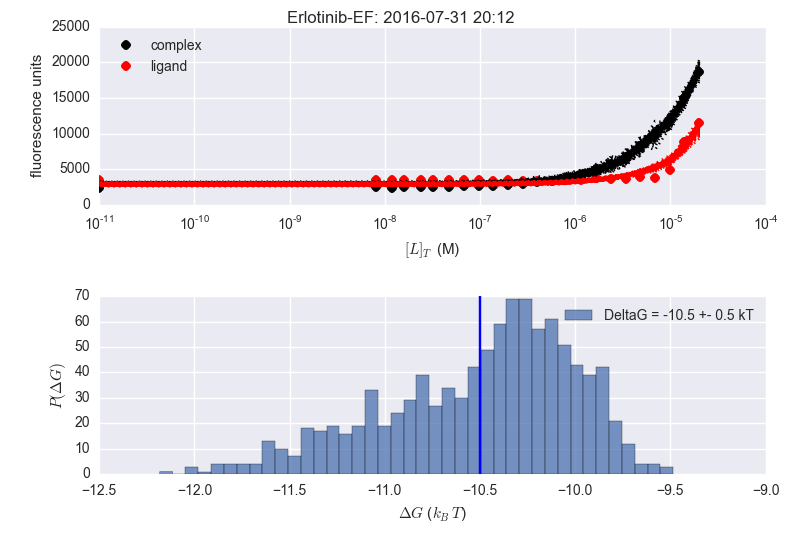
In the image below the two adjacent plots are from the same dataset, but the analysis is done at different times (notice time stamp). The plotting is slightly different (delG in title vs. in legend) as this is what I was playing with when repeating the analysis. Seems to be fine for Bosutinib Isomer, but not for Erlotinib (sorry the image is a bit fuzzy...).

Currently parameters for MCMC sampling are:
niter = 500000 # number of iterations
nburn = 50000 # number of burn-in iterations to discard
nthin = 500 # thinning interval
I'm supre-confused as to why the results are inconsistent for erlotinib. There's no way the average DeltaG is -11.5 kT in that lower right panel---just look at the histogram!
I wonder if the maximum likelihood estimate---rather than the mean of the MCMC sampler history---is being reported as -11.5?
So in this plot is:
plt.hist(mcmc.DeltaG.trace(), 40, alpha=0.75, label="DeltaG = %.1f +- %.1f kT"%(DeltaG, dDeltaG))
where
            DeltaG = map.DeltaG.value
            dDeltaG = mcmc.DeltaG.trace().std()
I chose this because it is what's currently used in show_summary.
If I change to DeltaG = mcmc.DeltaG.trace().mean() this seems improved.
Should I also change this in show_summary, was there a reason for choosing map there?
What does MAP add out of curiosity?
What does MAP add out of curiosity?
Sorry for missing this earlier! MAP is similar to the solution that you would get from a standard likelihood-maximization scheme, though it's only a unique solution if the posterior is unimodal (which it may not be with something this complicated). But it's something like a "traditional" solution. It may not add much for us because our posterior may be more complicated---the mean may be much more robust.
Finally made a pull request with these choderalab/fluorescence-assay-manuscript#6
These are looking pretty good! We could do more sampling to smooth out those histograms, or use a kernel density estimate with an adaptive bandwidth, and maybe discard a bit more to equilibration. (Are we using automatic equilibration detection yet, or is the burn-in period fixed?)
So this definitely seems to be more of a problem for the spectra assays than the singlet assays:

