PedPy is a python module for pedestrian movement analysis. It implements different measurement methods for density, velocity and flow.
If you use PedPy in your work, please cite it using the following information from zenodo:
For setting up your Python Environment a Python version >= 3.10 is recommended (our code is tested with 3.10 and 3.11). To avoid conflicts with other libraries/applications the usage of virtual environments is recommended, see Python Documentation for more detail.
To install the latest stable version of PedPy and its dependencies from PyPI:
python3 -m pip install pedpyIf you want to install the current version in the repository which might be unstable, you can do so via:
python3 -m pip install --pre --index-url https://test.pypi.org/simple/ --extra-index-url https://pypi.org/simple/ pedpyFor first time users, have a look at the getting started notebook, as it shows the first steps to start an analysis with PedPy. A more detailed overview of PedPy is demonstrated in the user guide notebook. The fundamental diagram notebook shows how to use PedPy for computing the fundamental diagram of a series of experiments.
If you want to try out PedPy for the first time, you can find an interactive online environments for both notebooks here:
Note: The execution might be slower compared to a local usage, as only limited resources are available. It is possible to also upload different trajectory files and run the analysis completely online, but this might not be advisable for long computations.
For local usage of the notebooks, you can either download the notebooks and demo files from the GitHub repository or clone the whole repository with:
git clone https://github.com/PedestrianDynamics/pedpy.gitFor using either of the notebook some additional libraries need to be installed, mainly for plotting. You can install the needed libraries with:
python3 -m pip install jupyter matplotlibAfterward, you can start a jupyter server with:
jupyter notebookAfter navigating to one of the notebooks, you can see how the library can be used for different kinds of analysis.
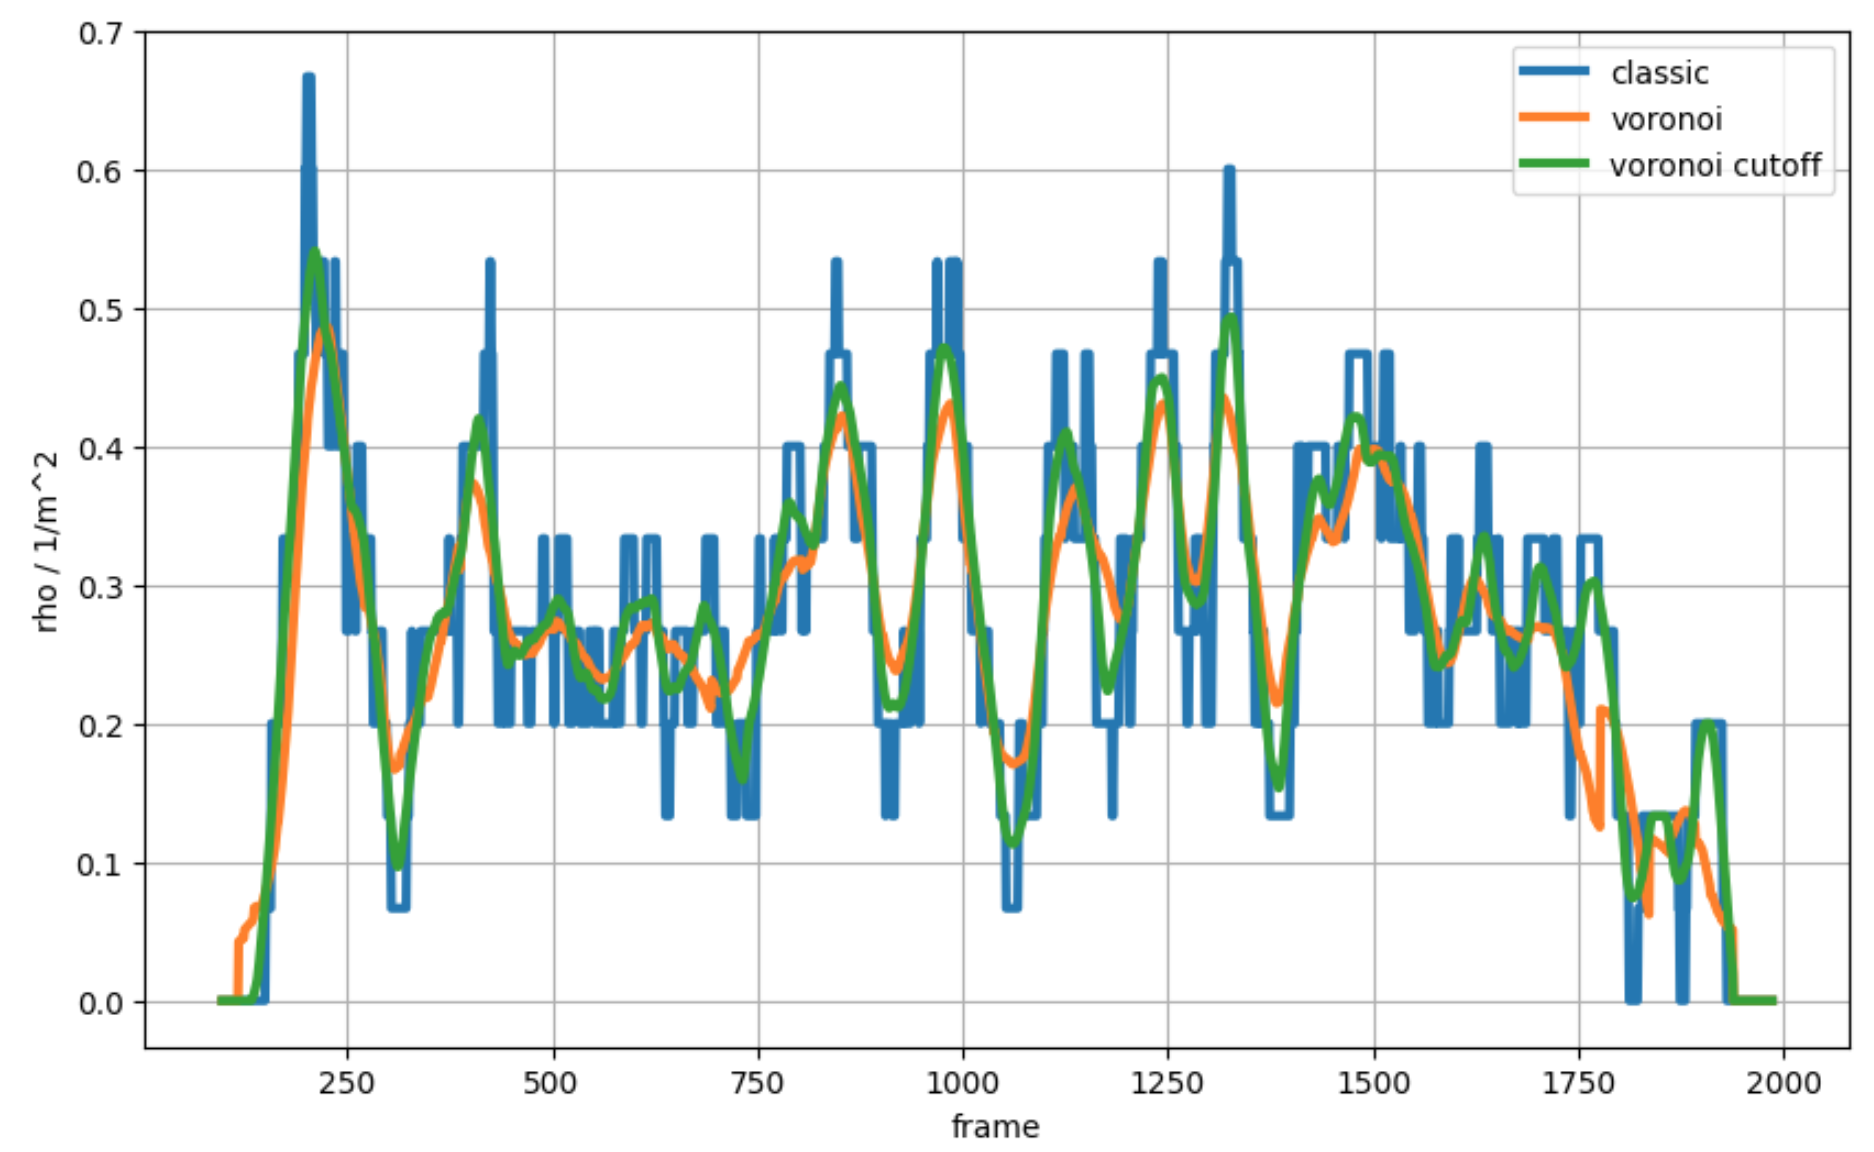
Some examples how the computed values can be visualized are also shown in the notebooks, e.g., density/velocity profiles, fundamental diagrams, N-T-diagrams, etc.


