This repo is an interactive data visualization project for Prof. Bailey.
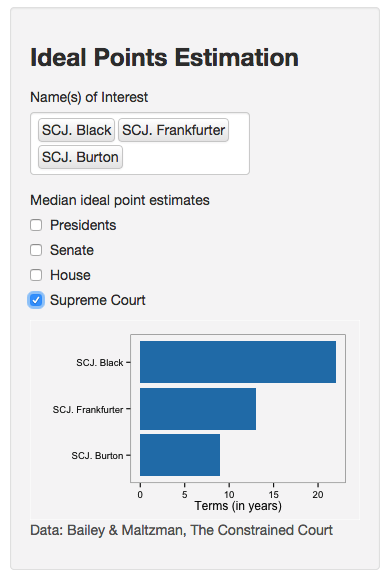
Users can select name(s) of justice of interest when they want to compare ideal points for each justice.
Users can compare up to five justices.
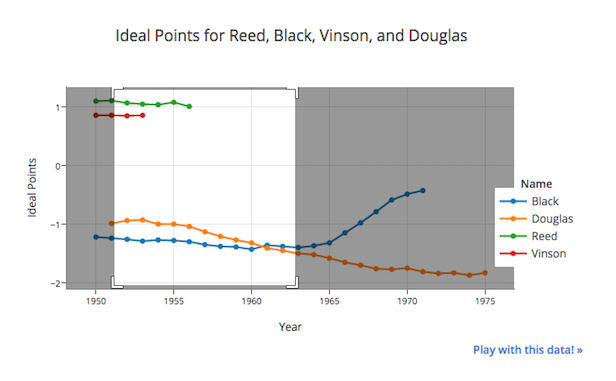
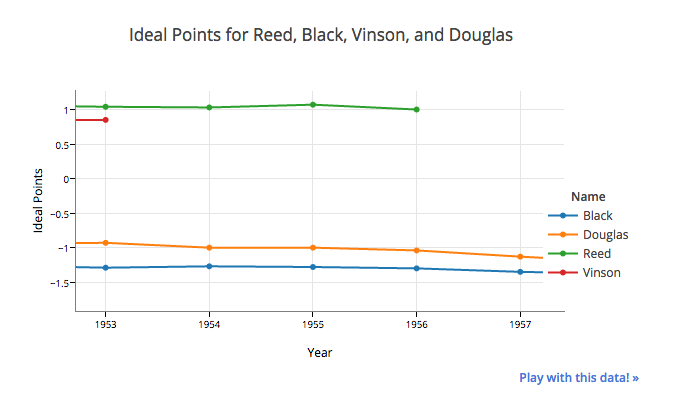
Users can zoom-in plot with ploy.ly frame.
-
Download the repo as a zip file (or clone it)
-
Set the
IdealPointsfolder as the working directory in R. -
Change the API key in
server.Rto an active one (see email or register with plot.ly). -
Install the
plotlypackage from GitHub# Install and load the devtools package. install.packages("devtools") library("devtools") # install plotly install_github("ropensci/plotly")
-
Call
shinyinside Rshiny::runApp()


